# Visualization Server User Manual
| User Manual | Version | Compiled By | Date |
|---|---|---|---|
| Big Data Visualization Plugin | V1.0.0 | Wang Jiale | 2025.03.03 |
# Front-end and Back-end Plugin Installation
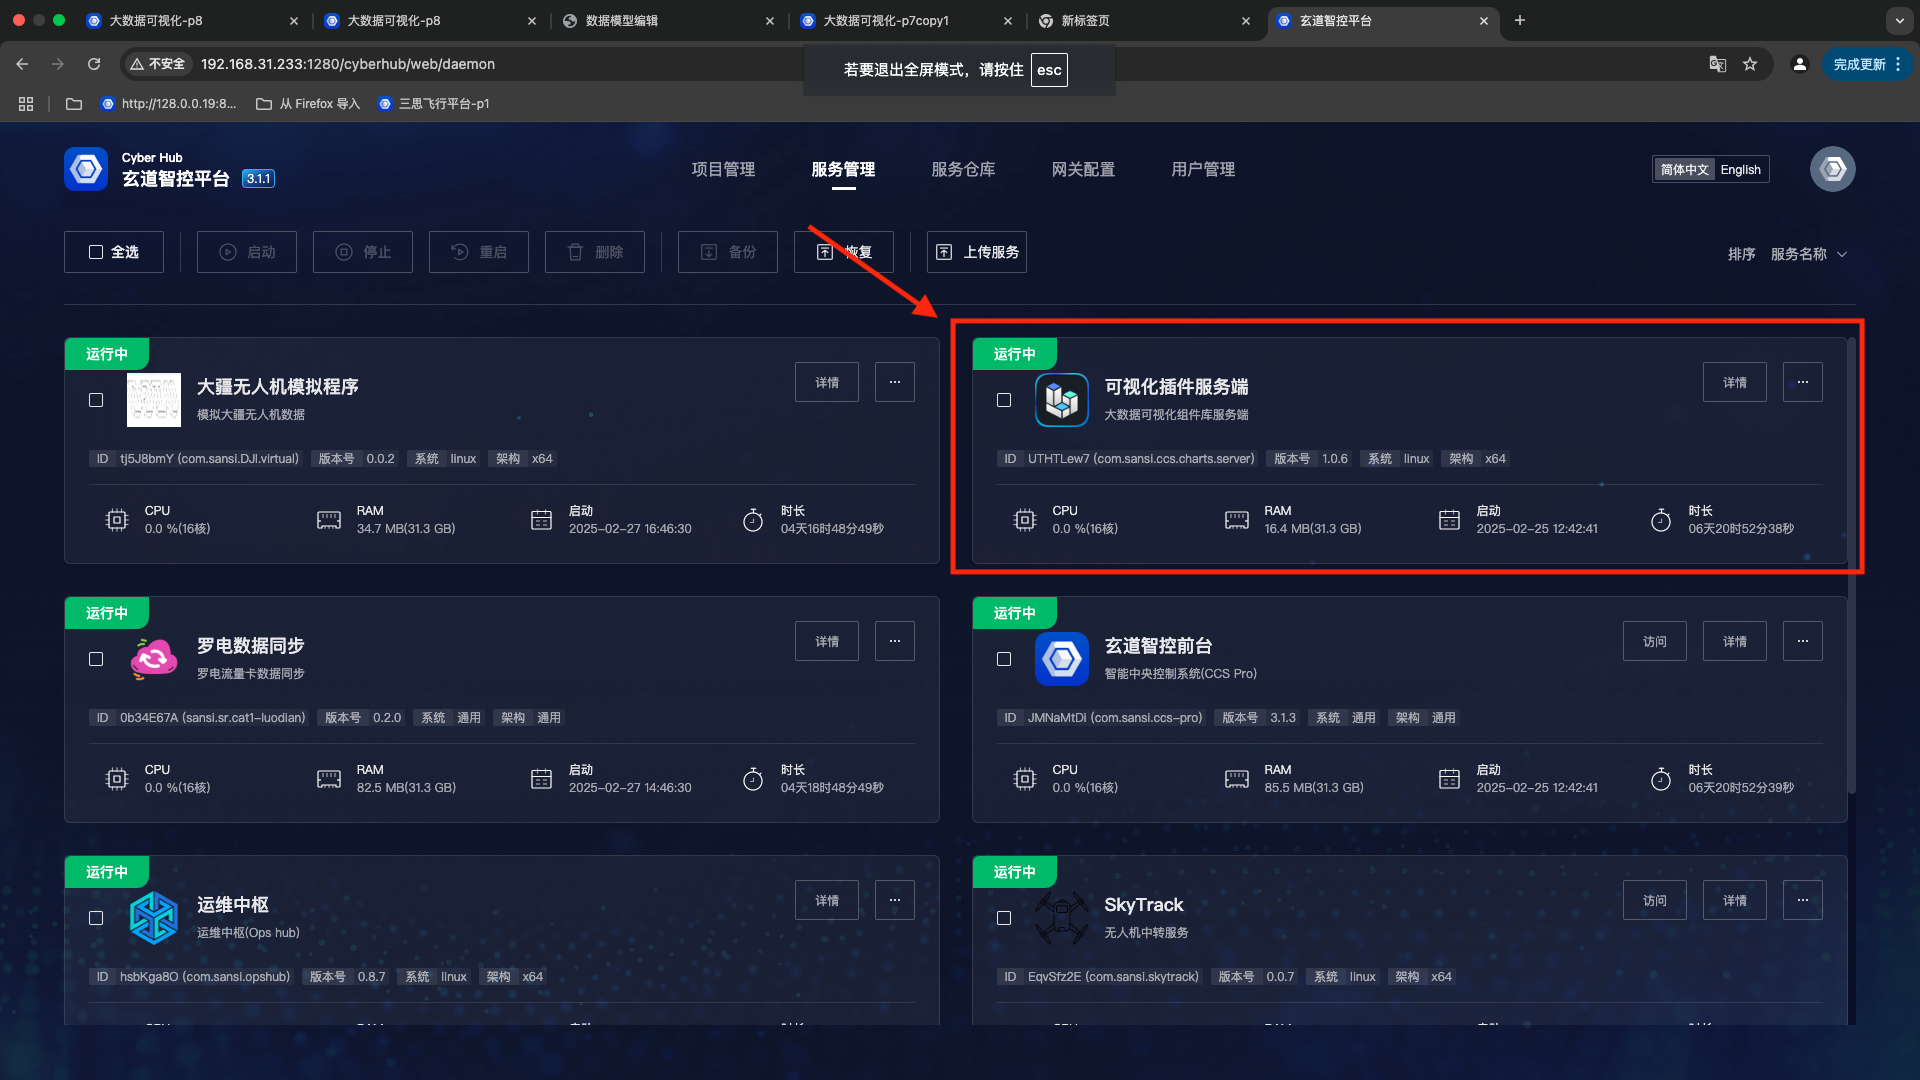
- Server => Server Management => Big Data Visualization Installation
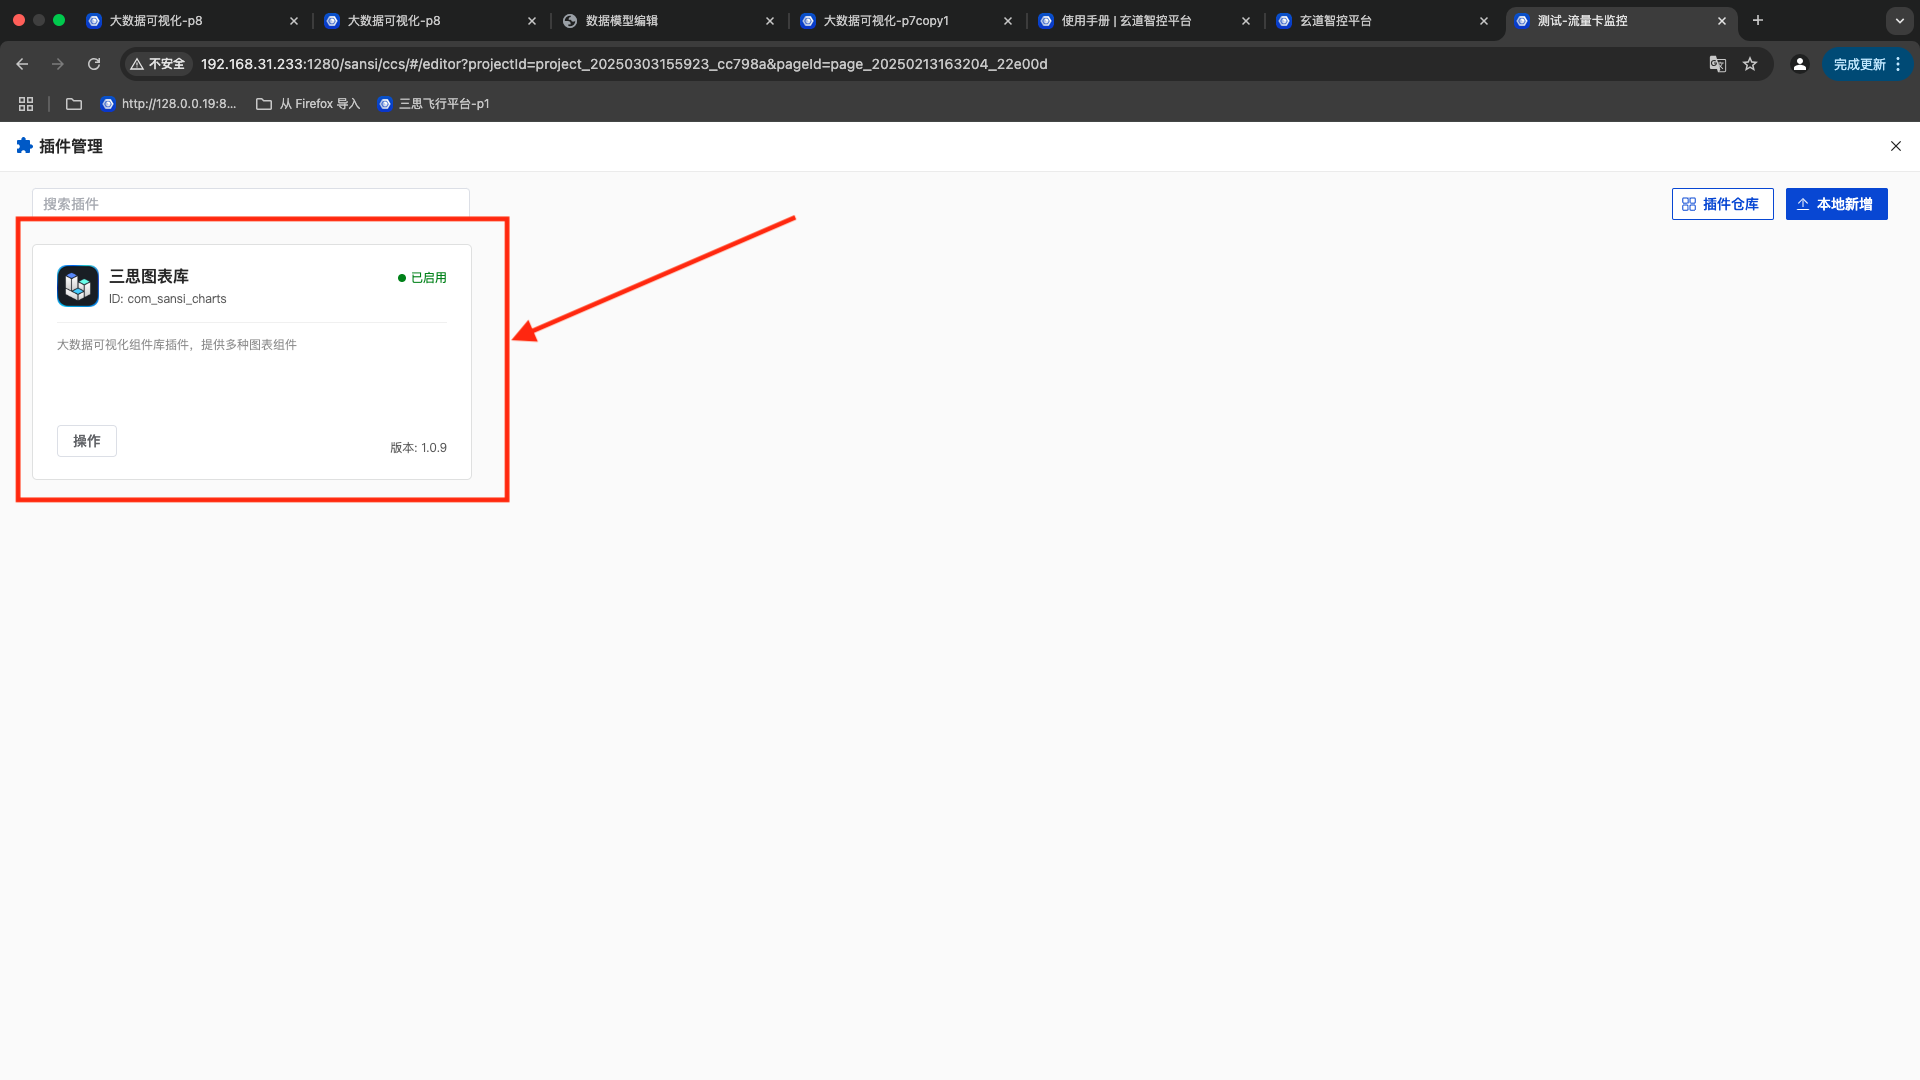
- Front-end => Plugin Management => Big Data Visualization Plugin
# Component Configuration Example
Specific configurations require support for visualization chart concepts. Reference address for visualization chart concepts (ECharts Reference Documentation (opens new window)).
Address of the visualization example project: Visualization Example Project (opens new window).
Drag a visualization component (the component will have a default style).
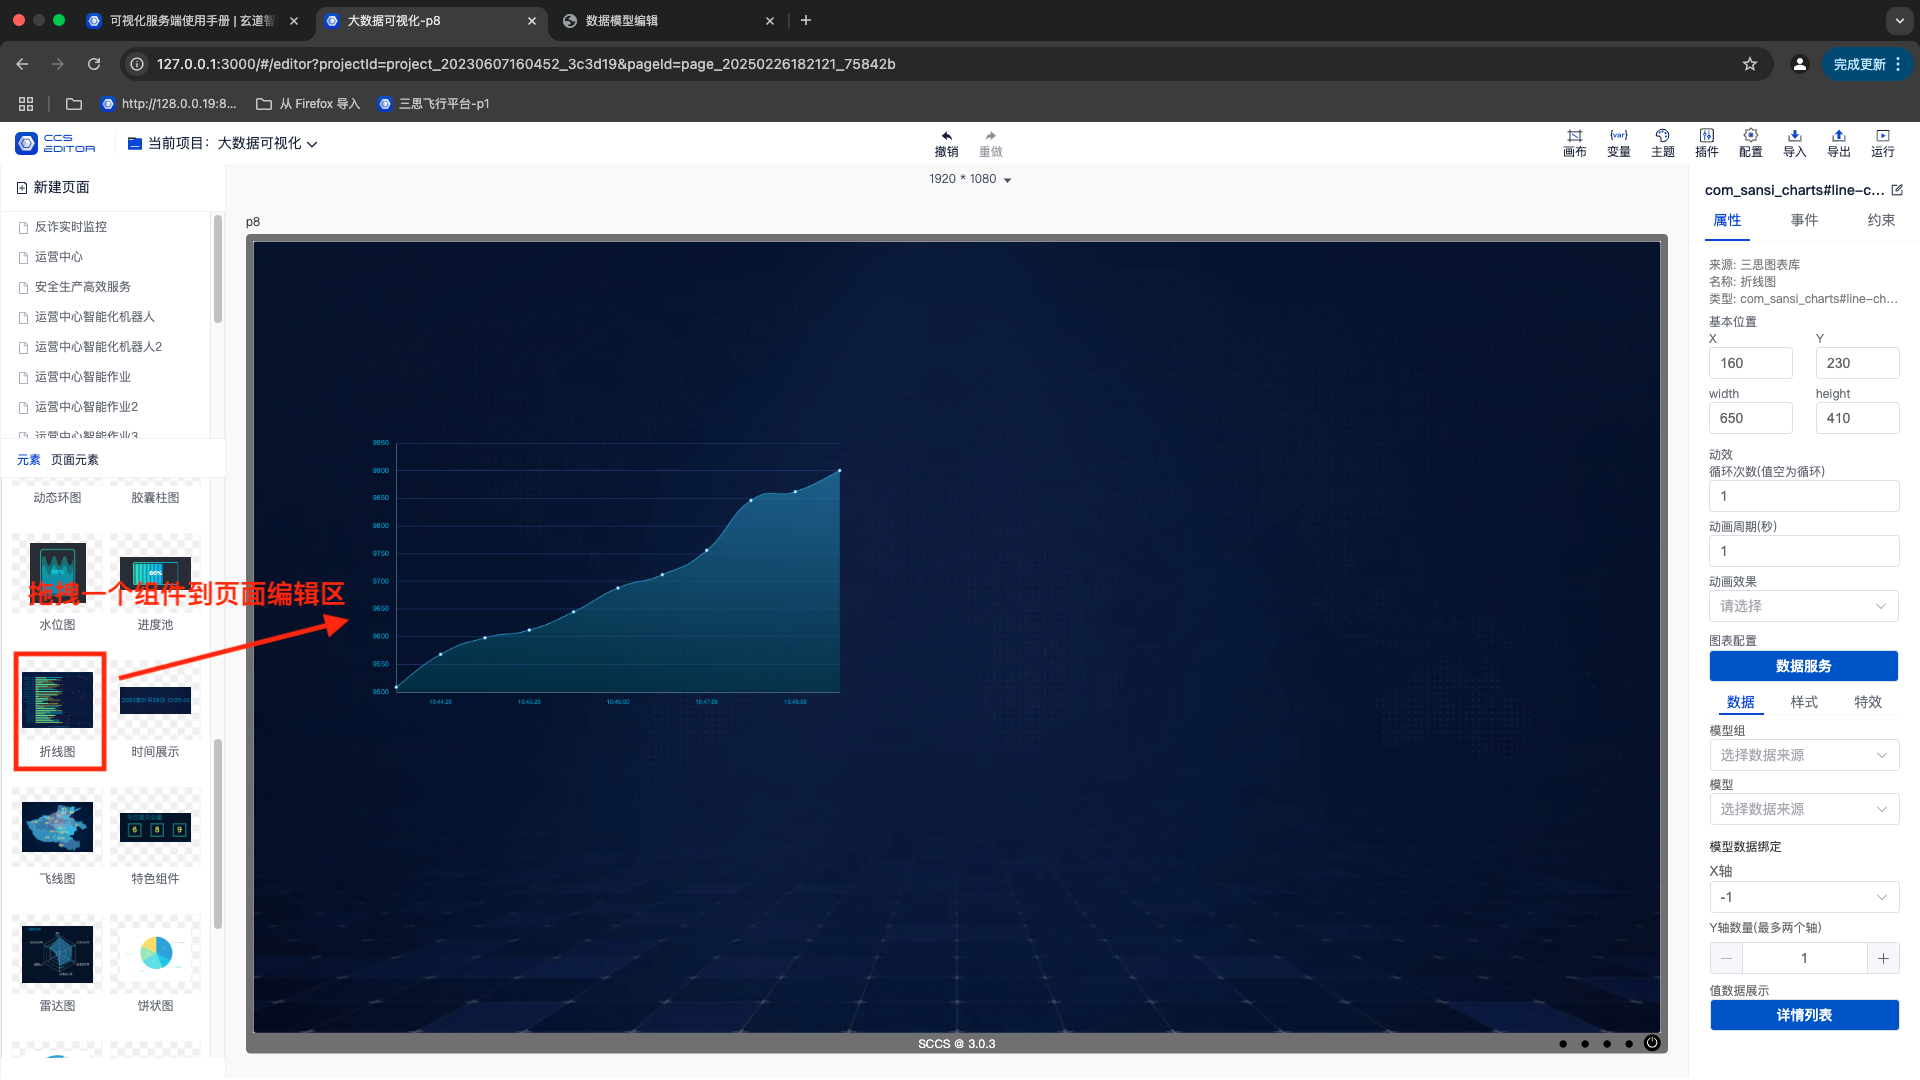
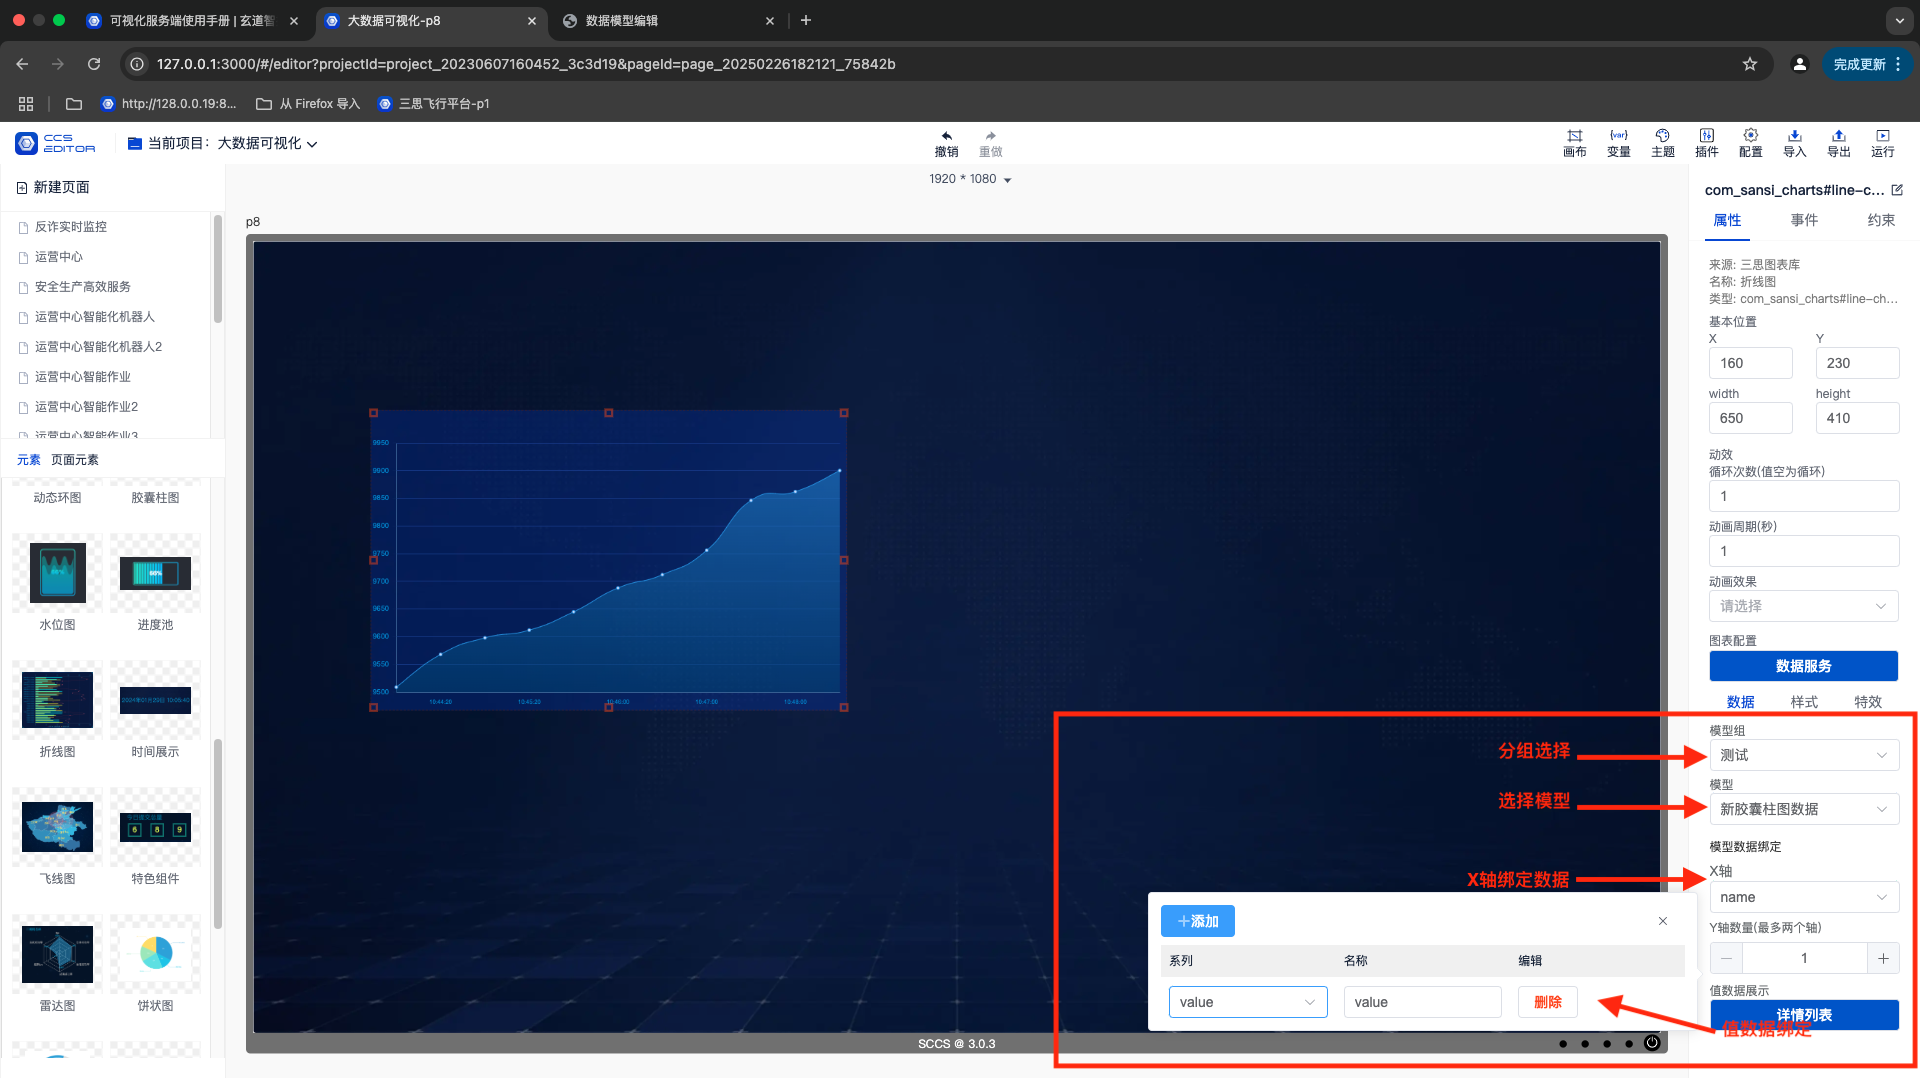
Configure data binding.
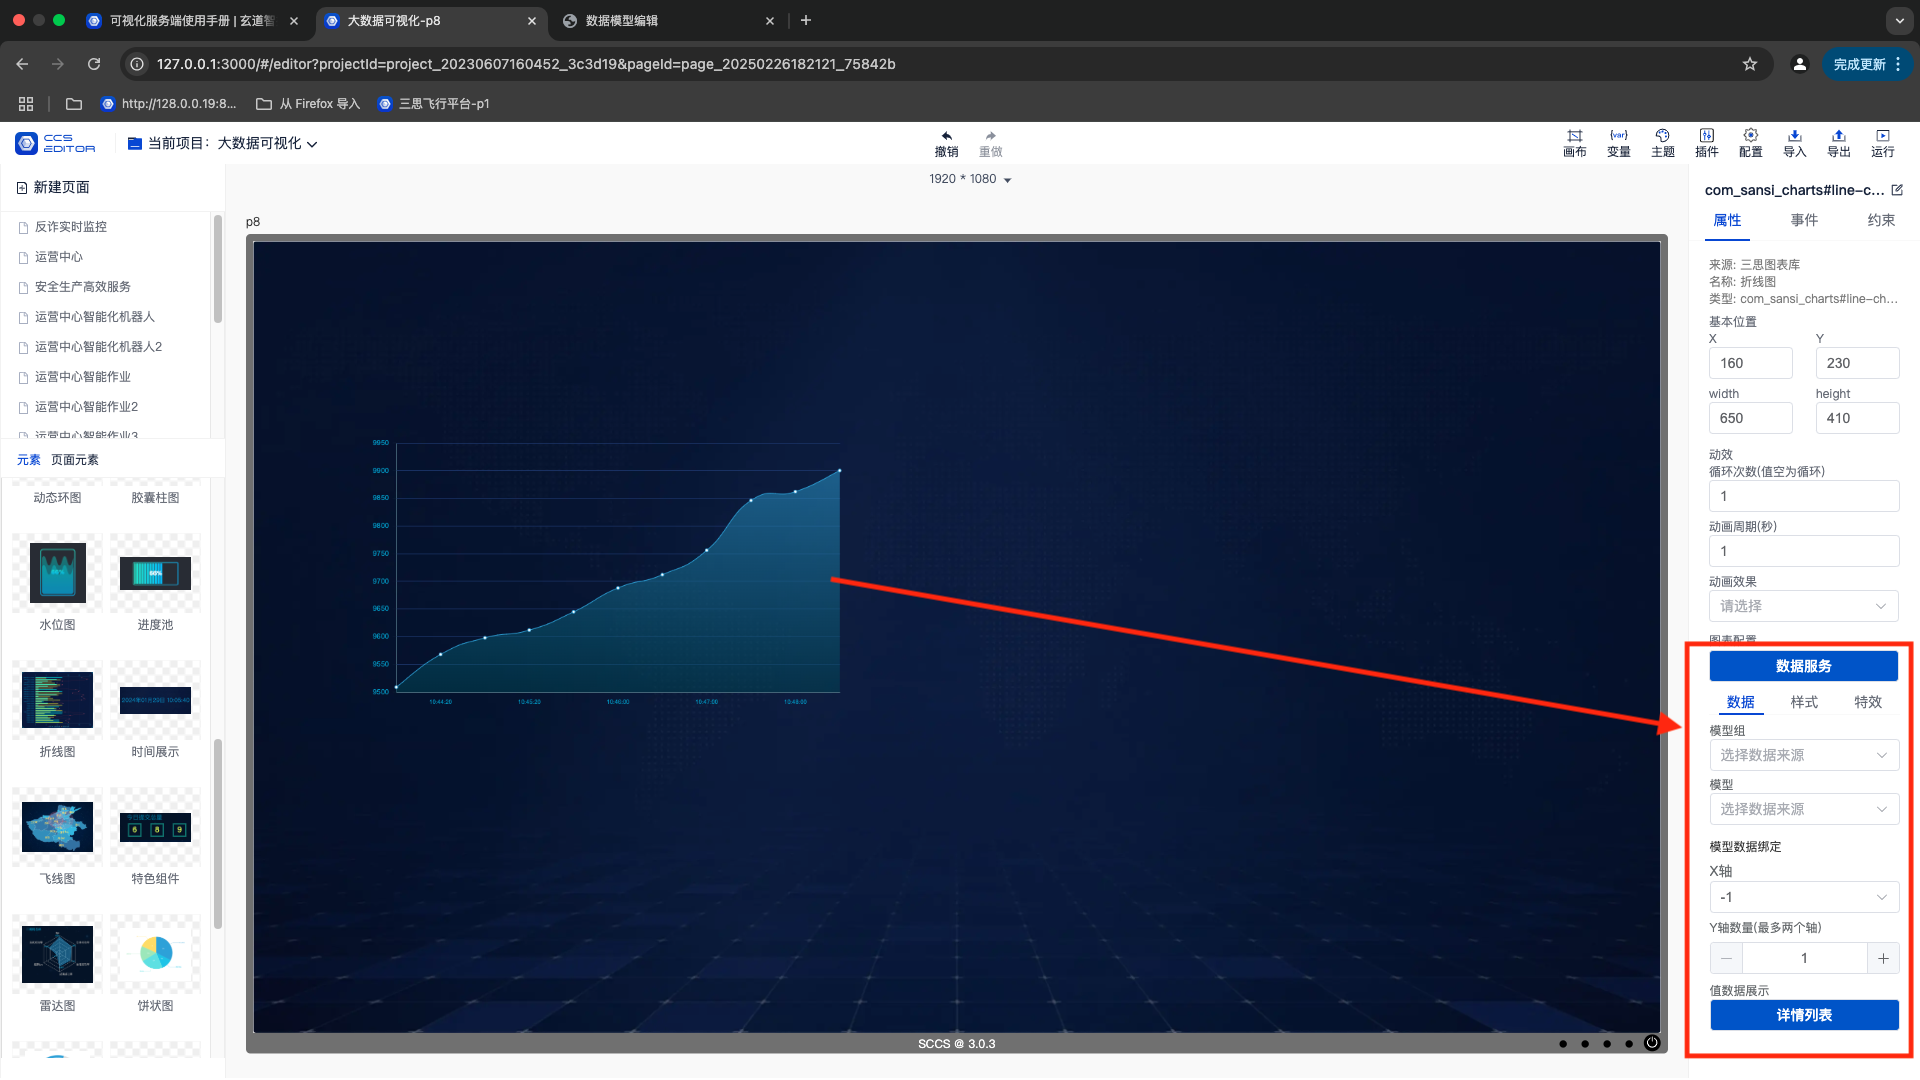
Bind model groups, data models, and x and y-axis data.
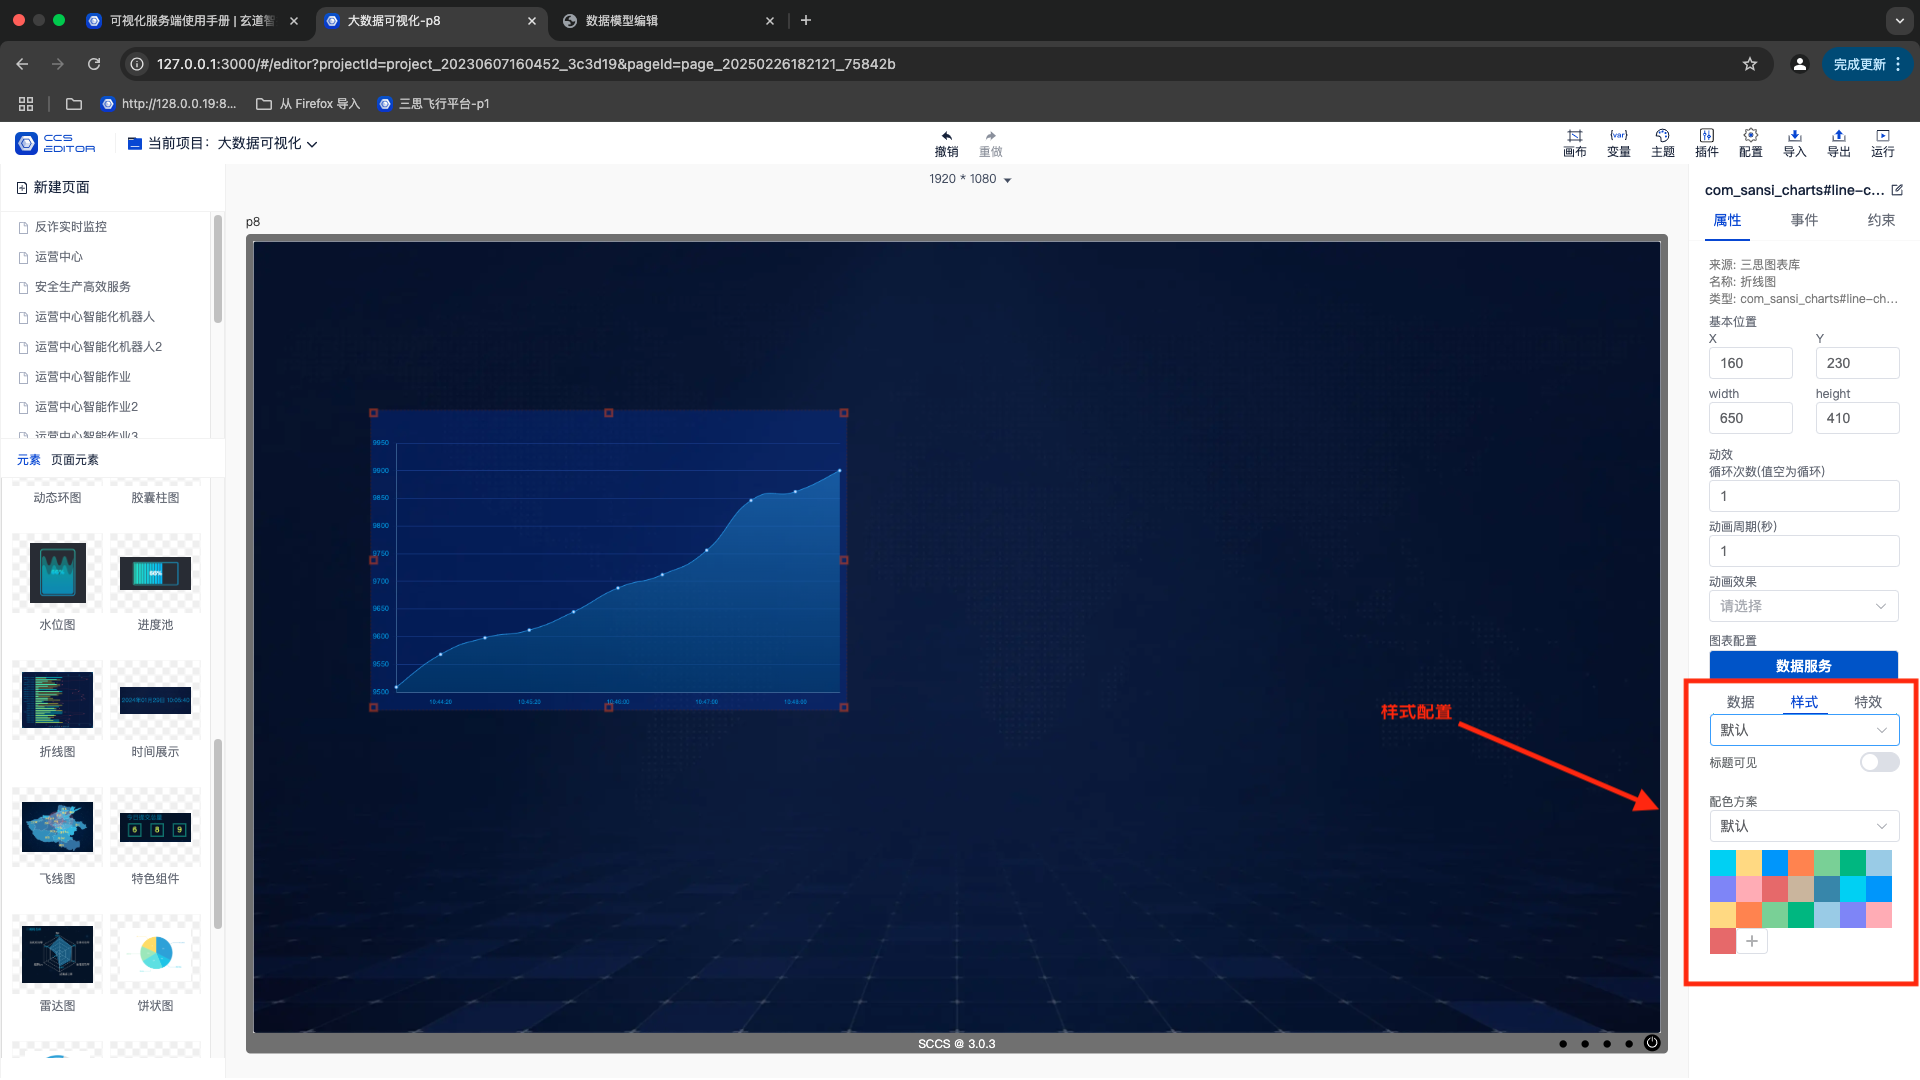
Configure component styles.
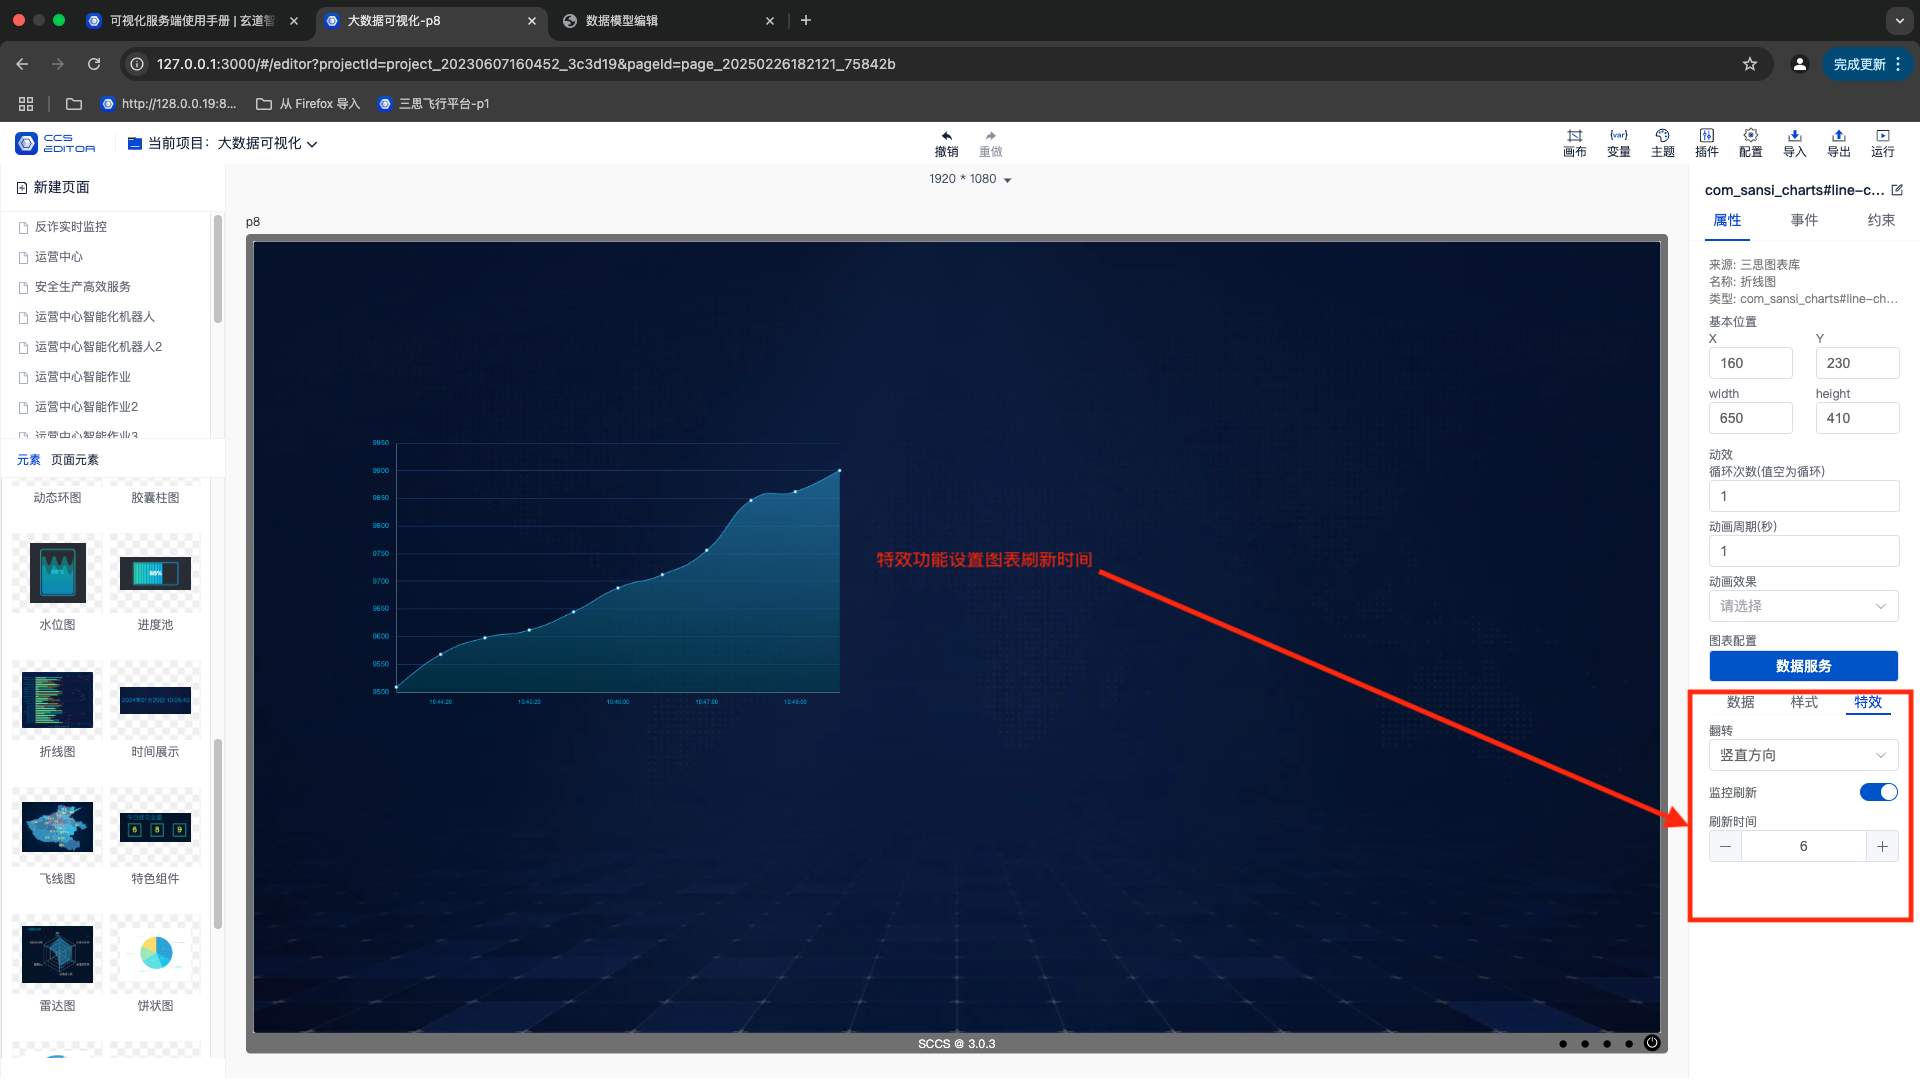
Configure special effects.
- Configure the chart refresh time in seconds.
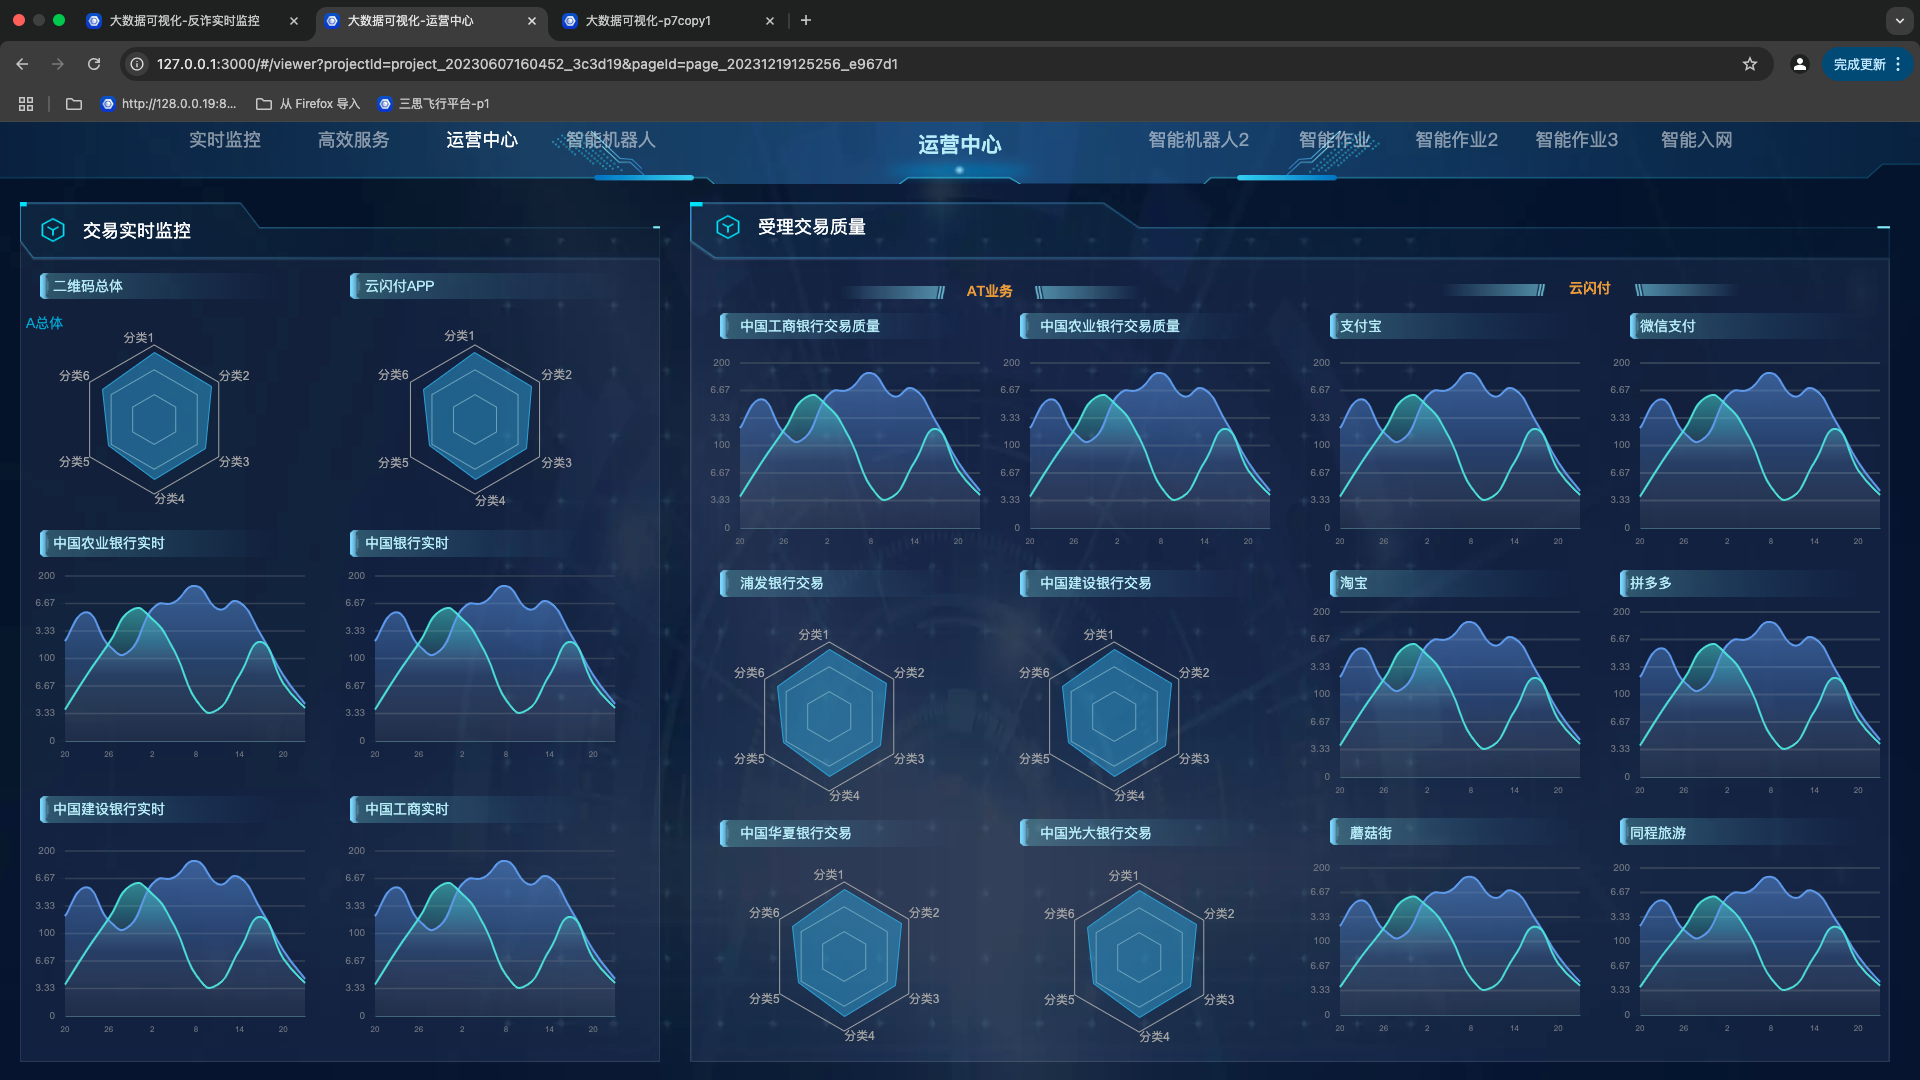
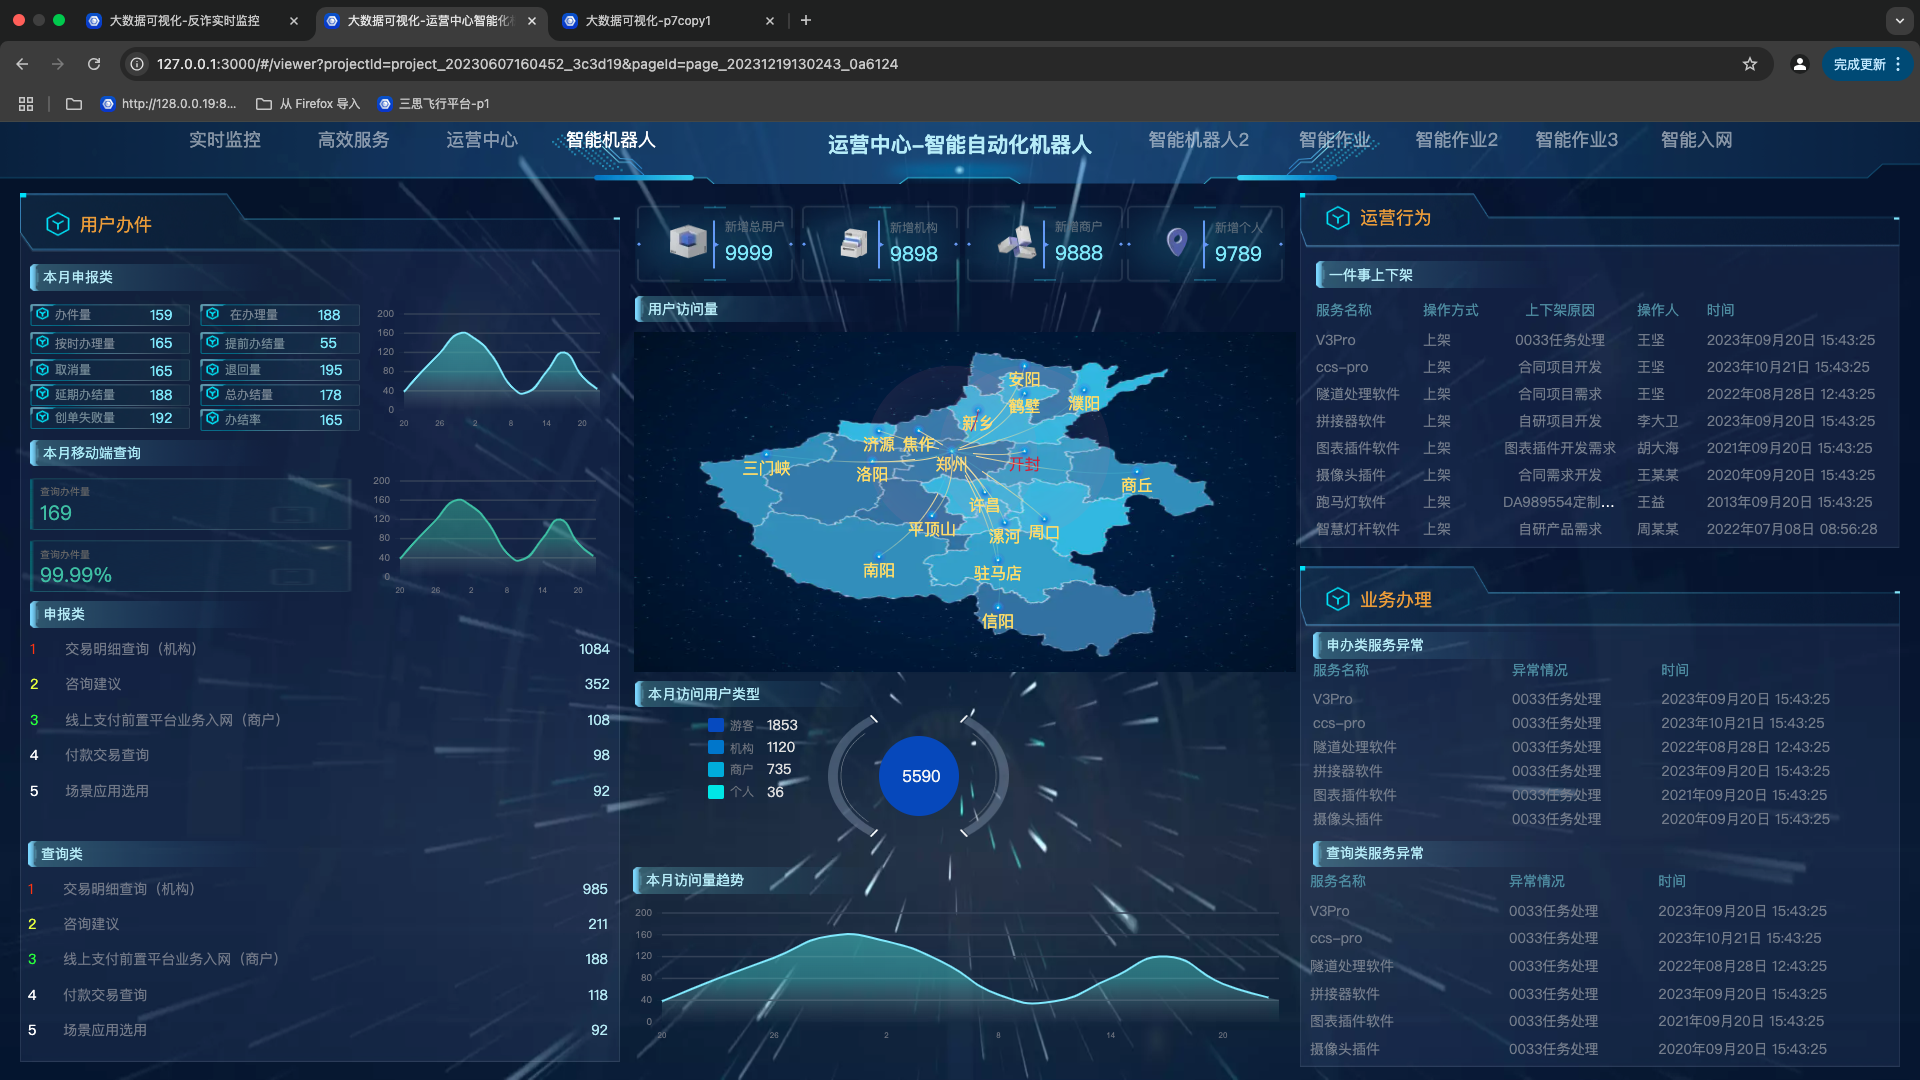
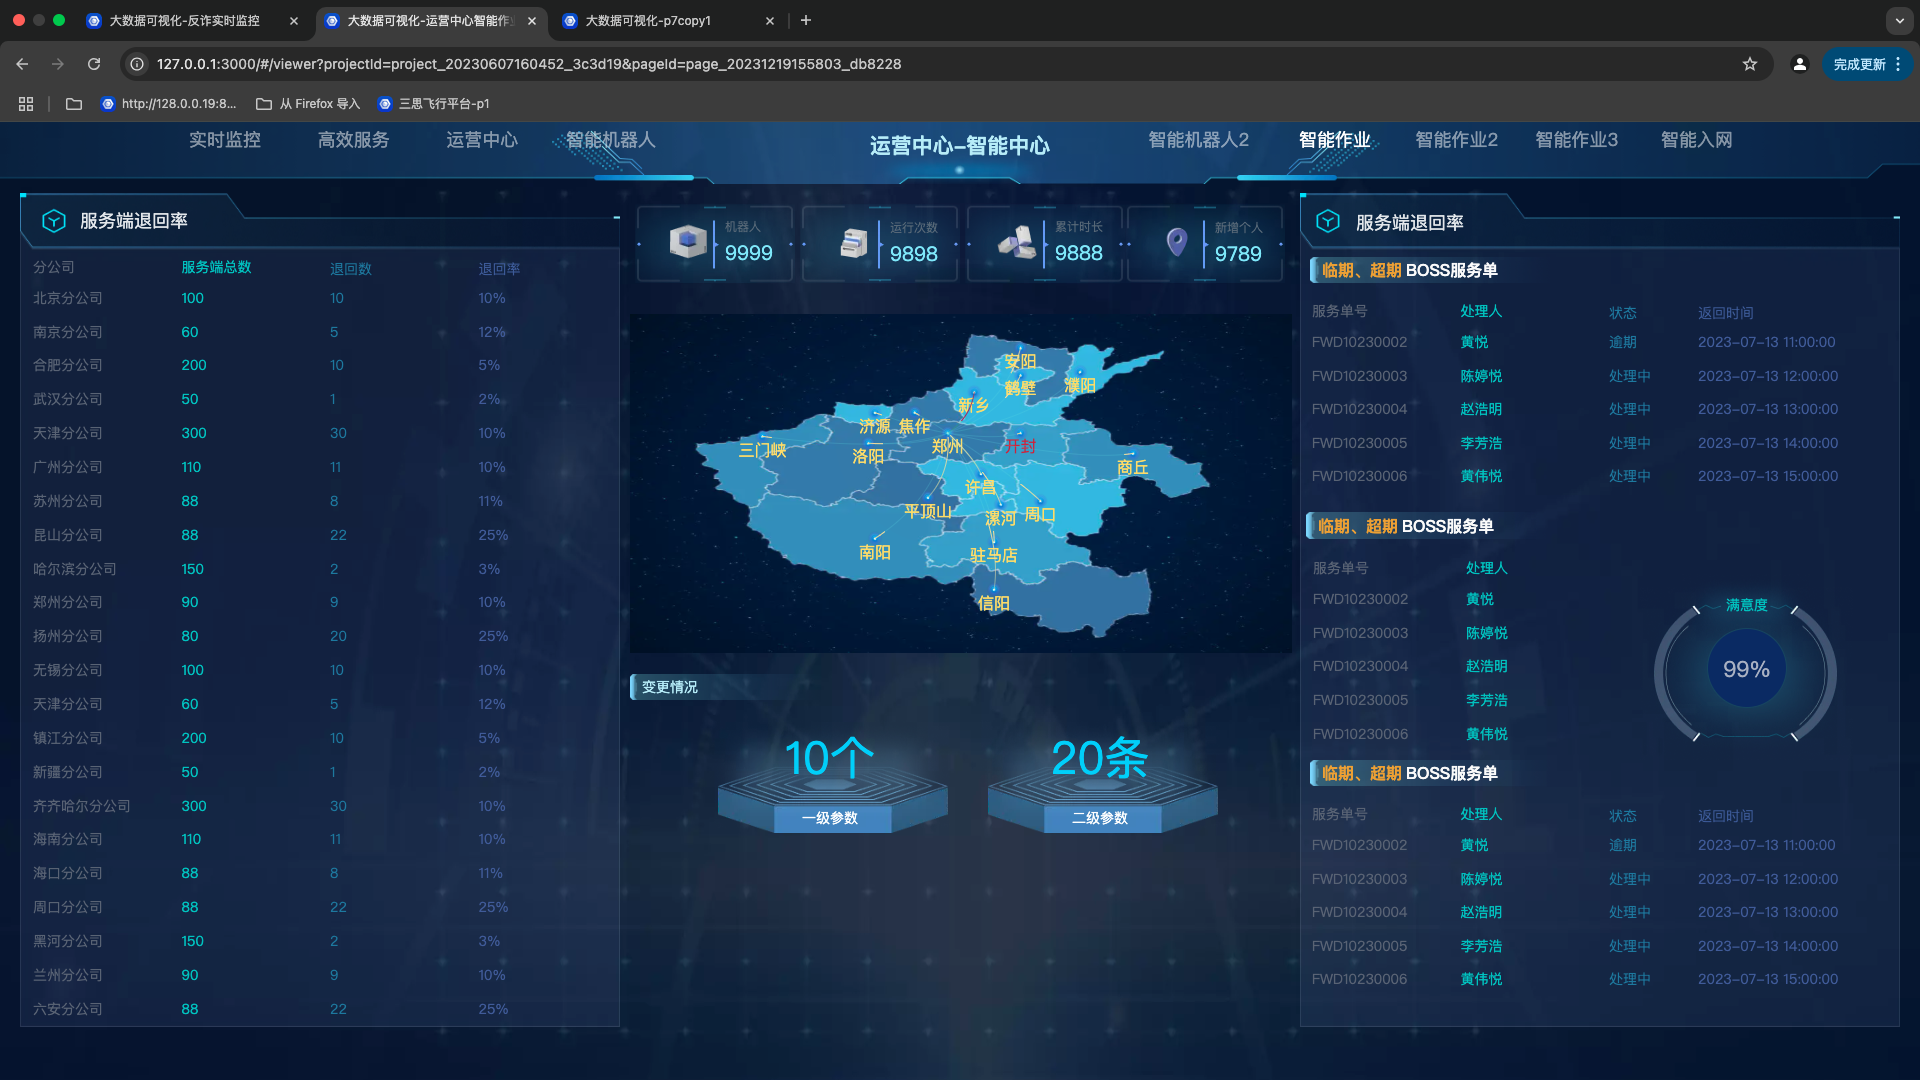
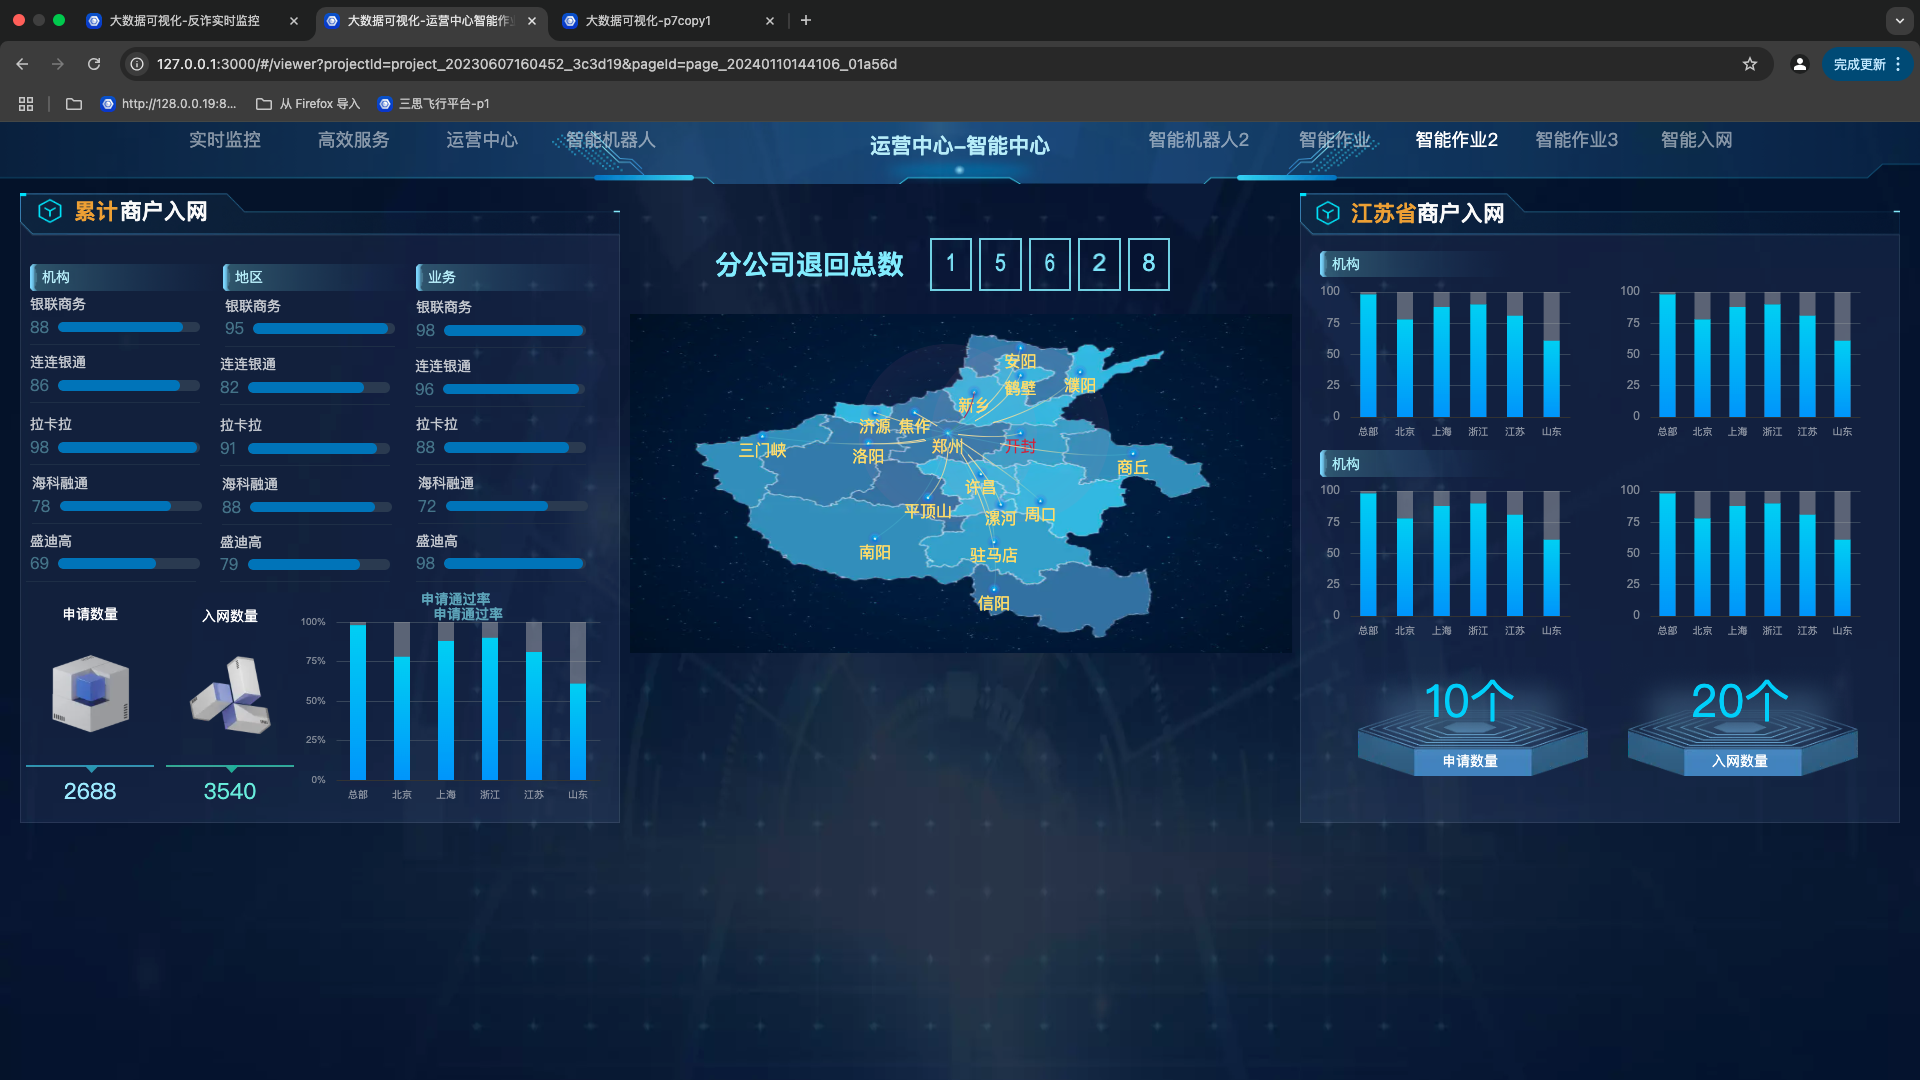
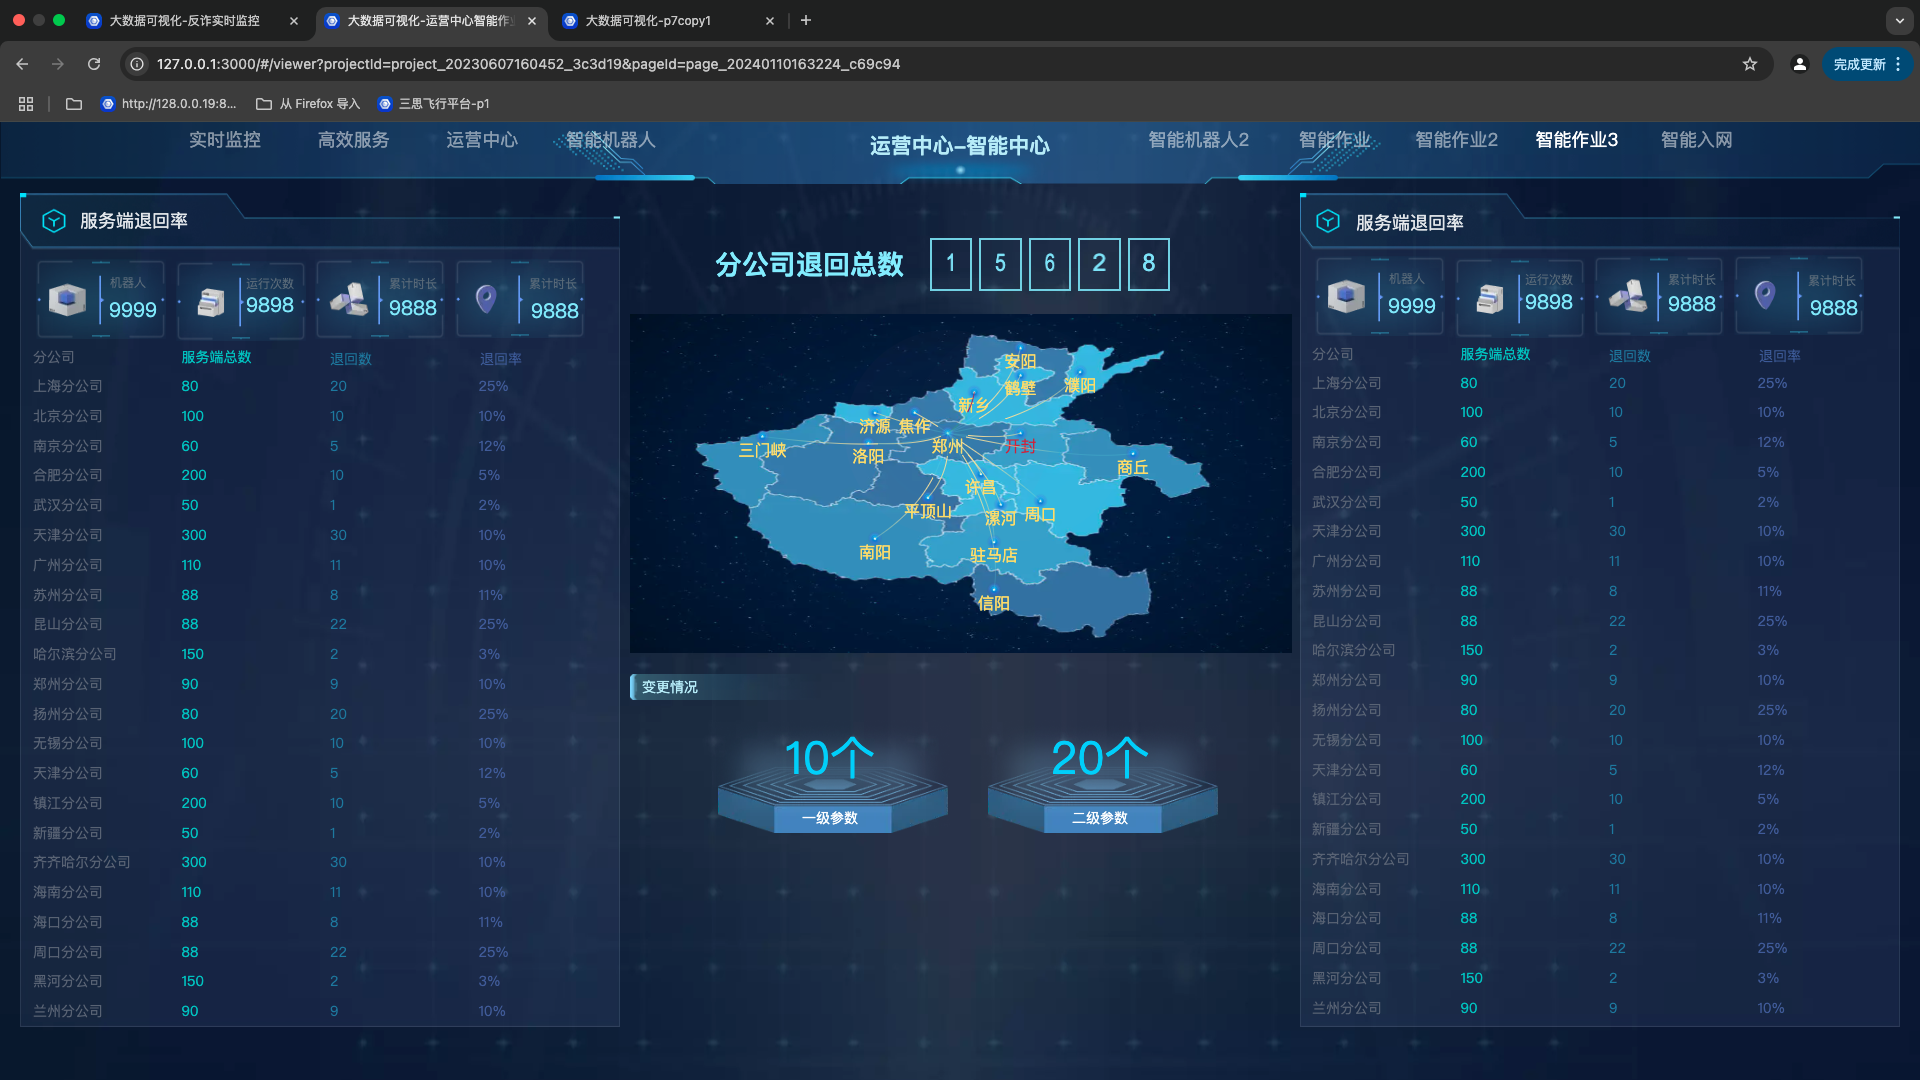
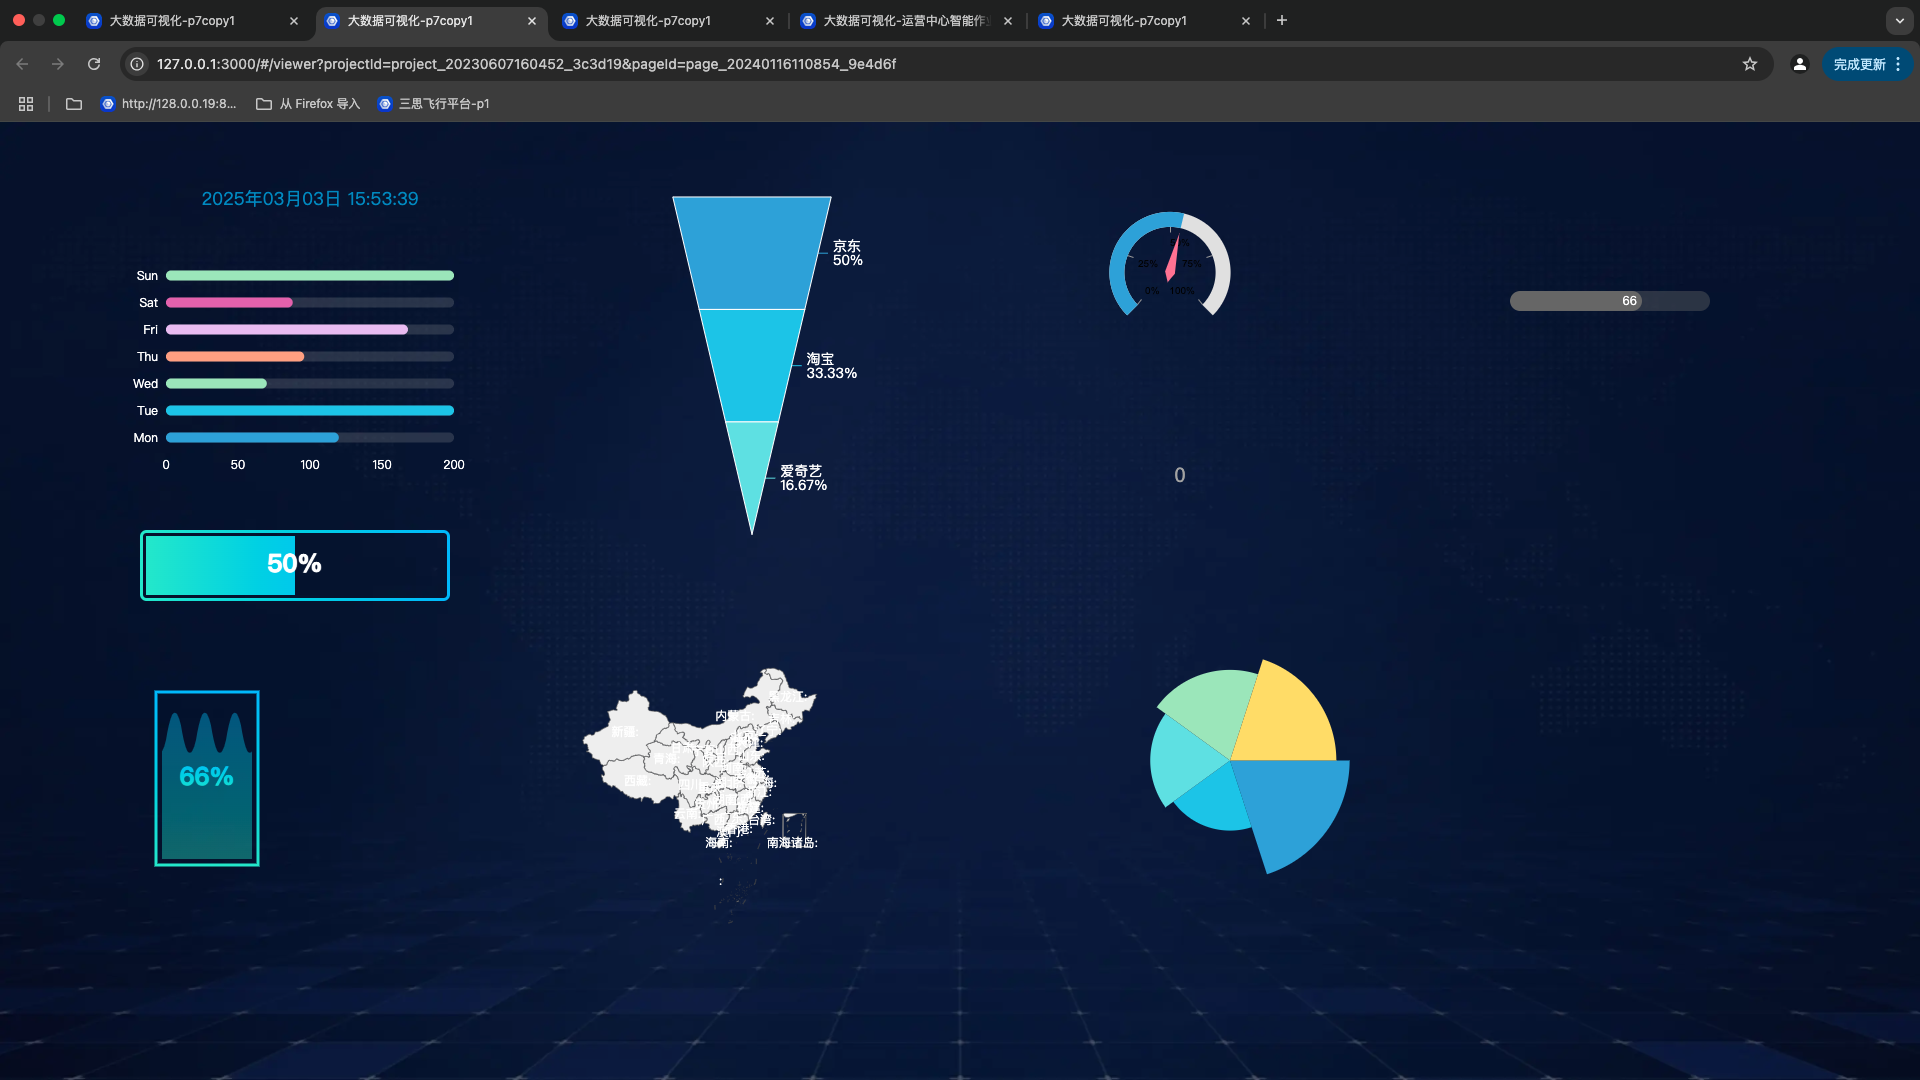
# Preview of All Components
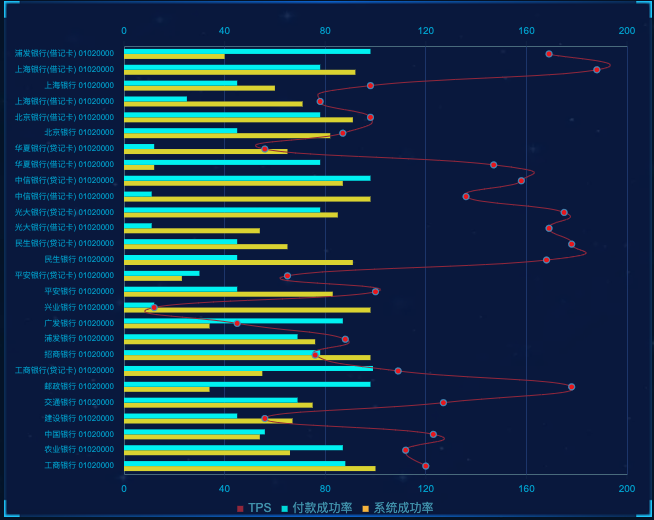
Line charts, bar charts, and mixed bar-line components.
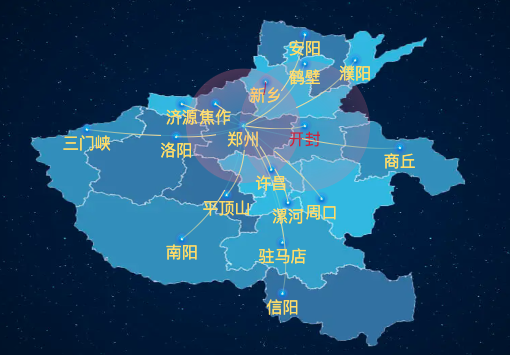
Flying line chart component.
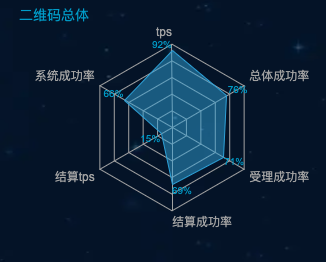
Radar chart.
Digital flipper.

Time display component.

Featured component.

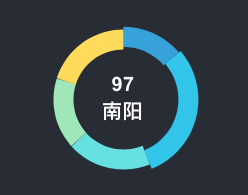
Dynamic ring chart component.
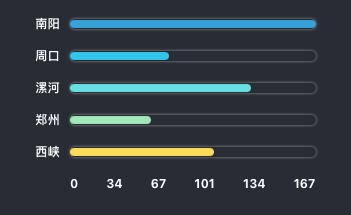
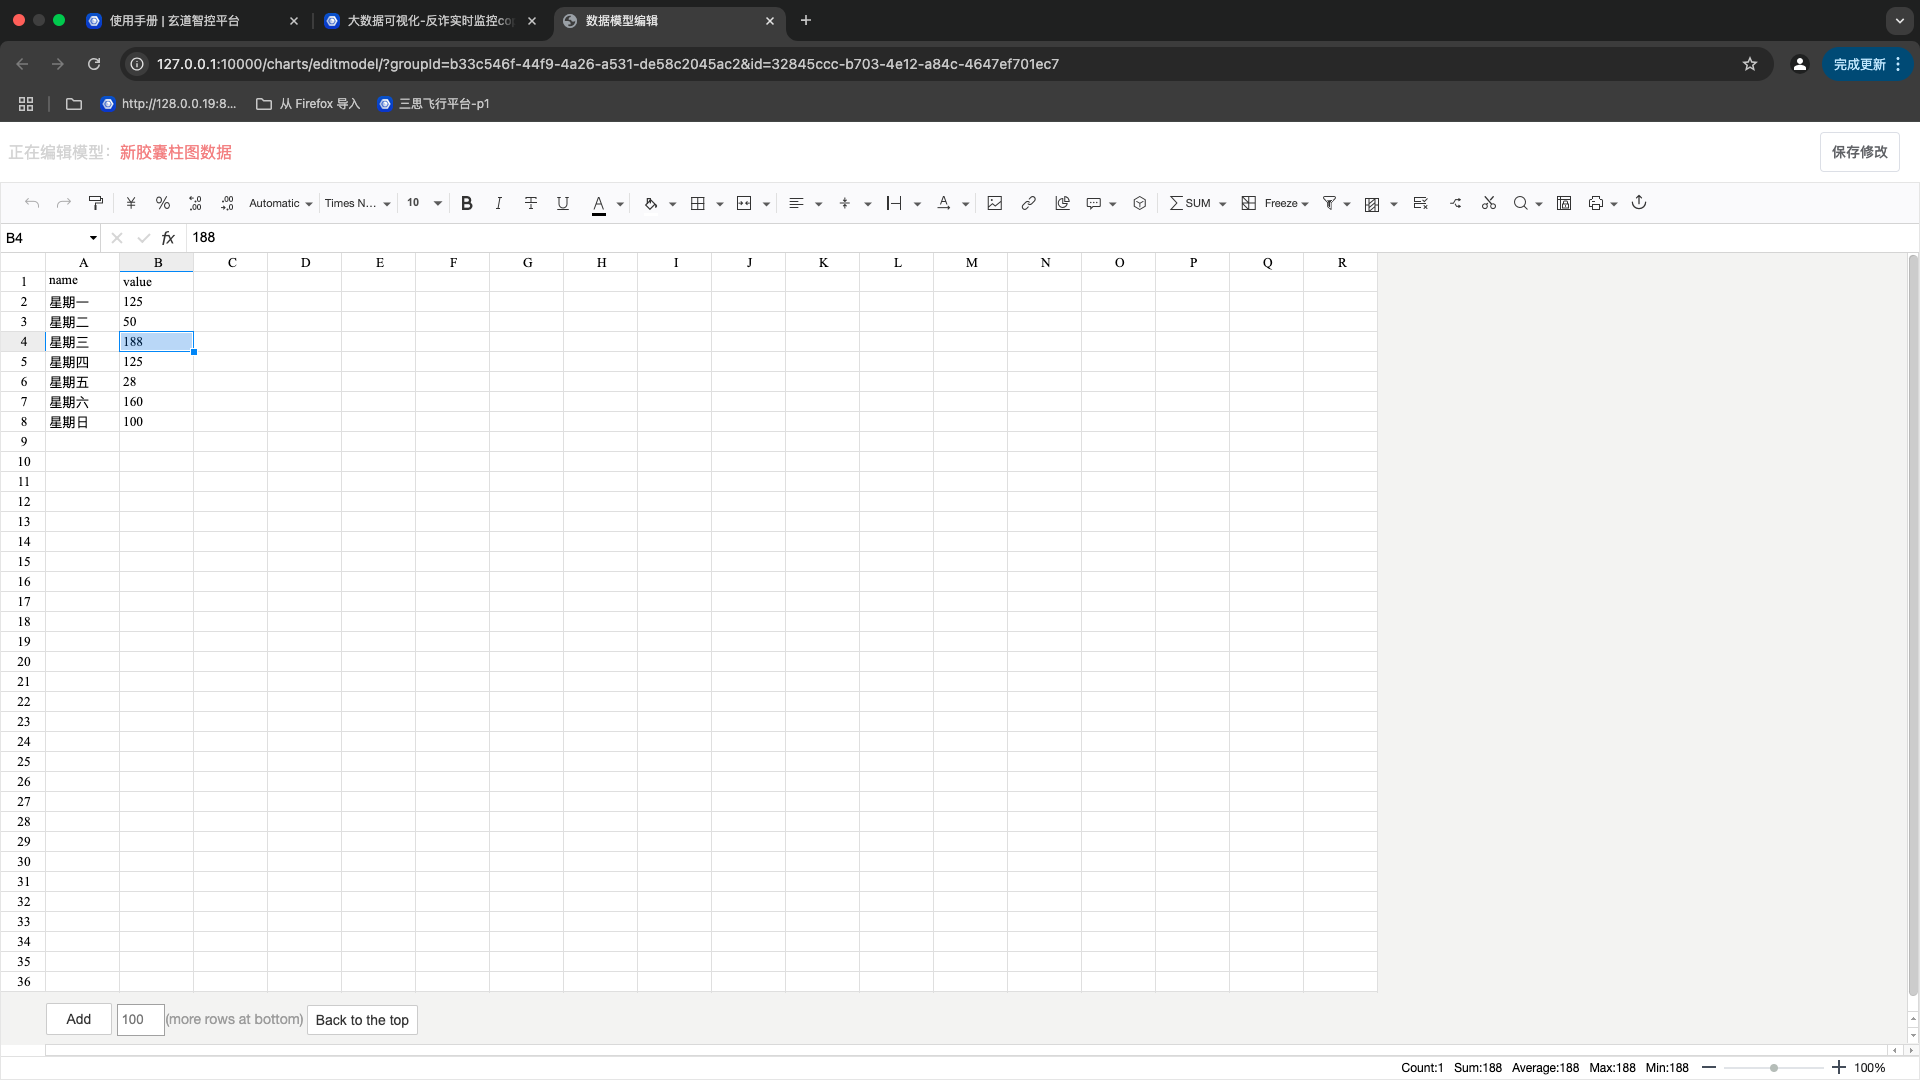
Capsule bar chart component.
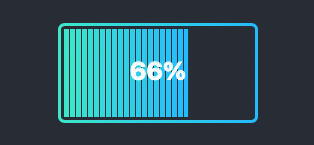
Progress bar component.

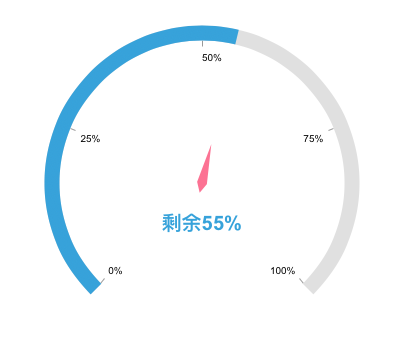
Gauge component.
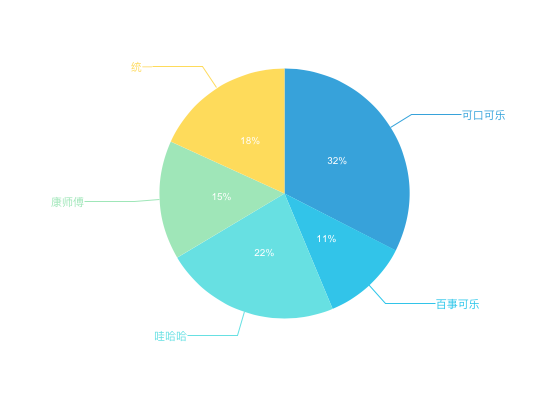
Pie charts and rose pie charts.
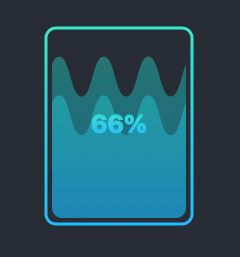
Water level chart component.
Progress pool.
Decoration component.

Border component.

Digital flipper.

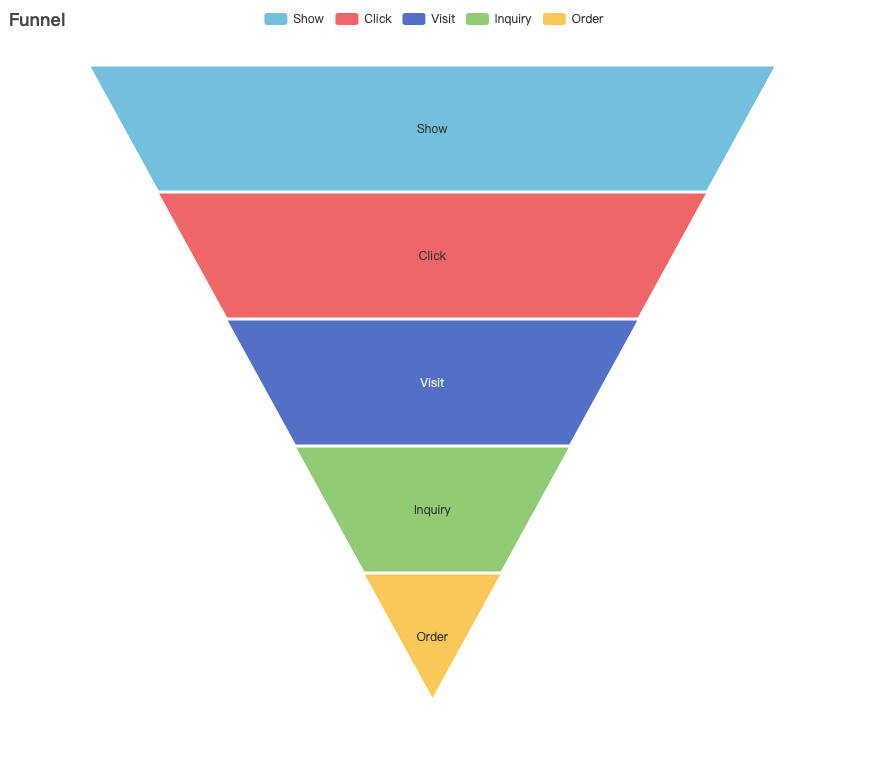
Funnel chart.
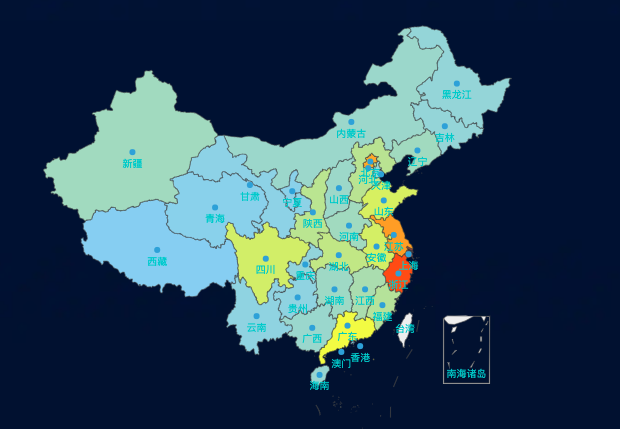
Map component.
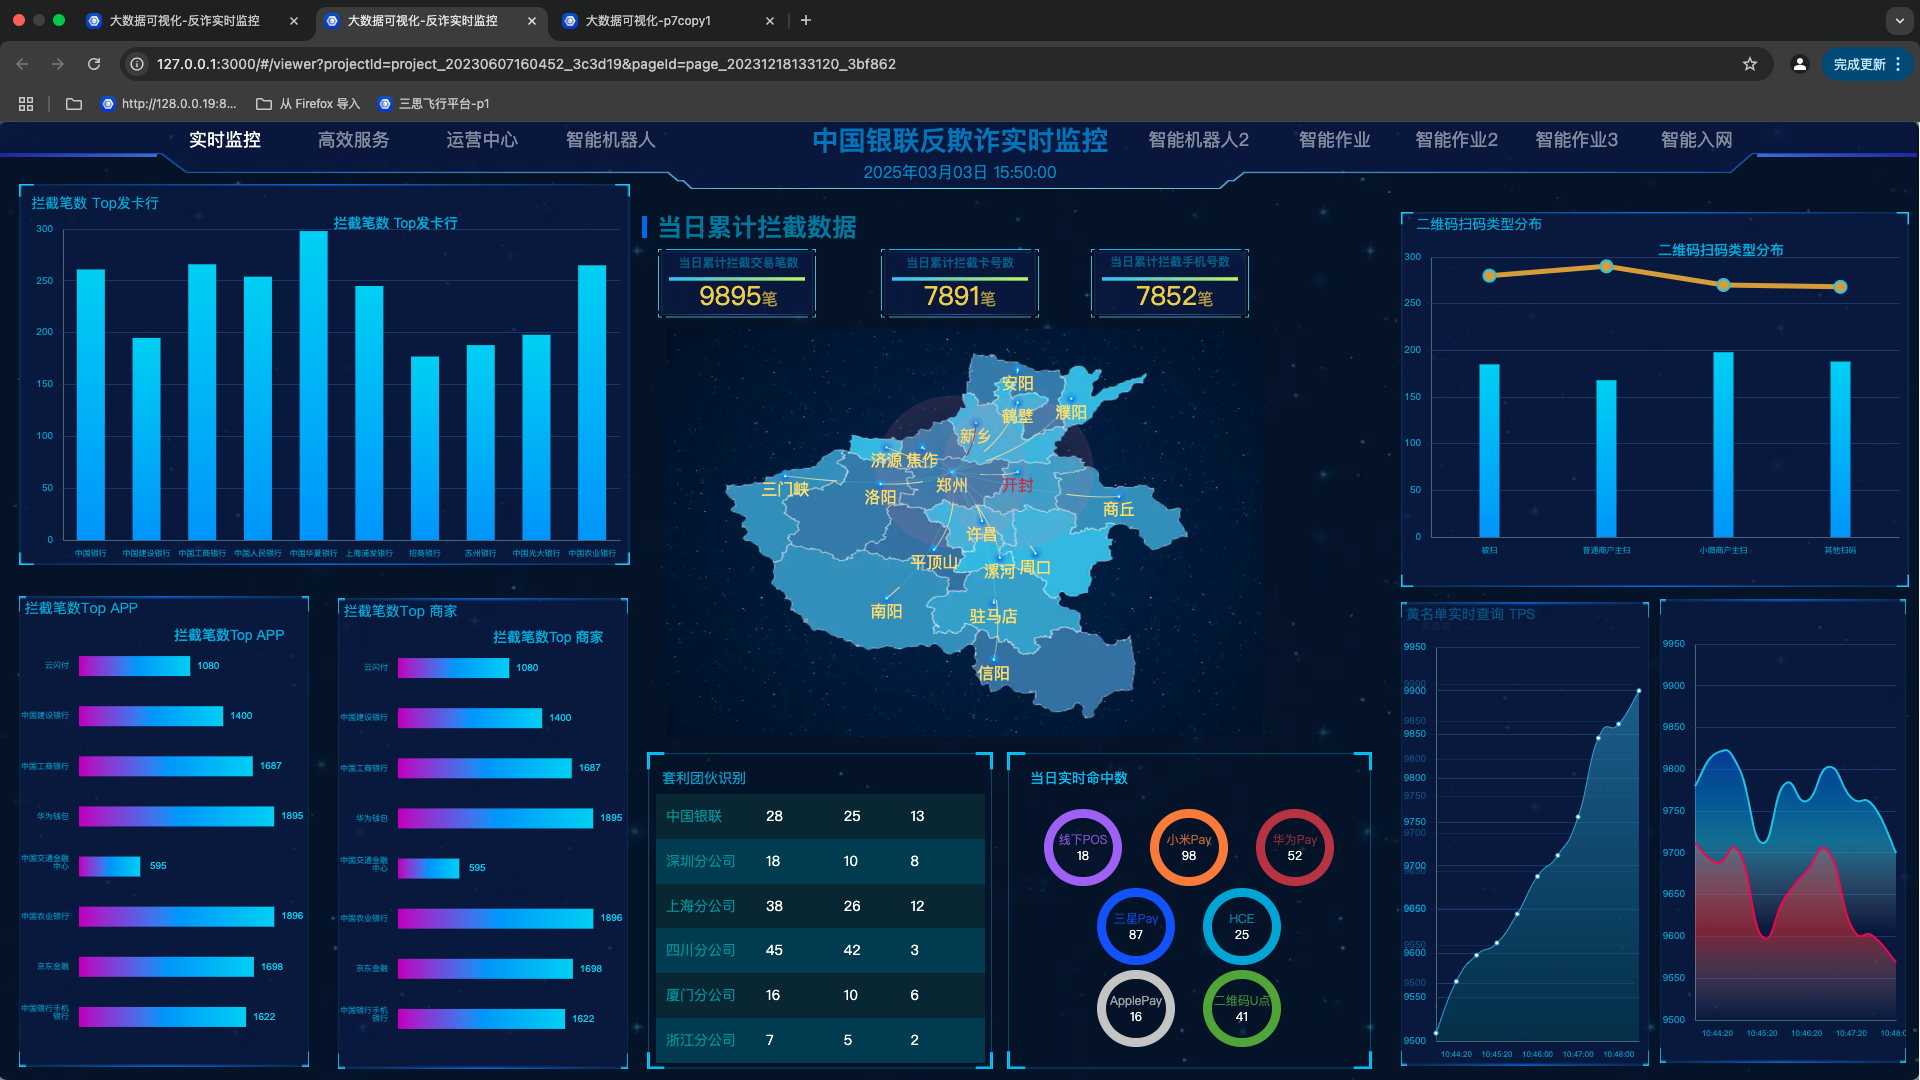
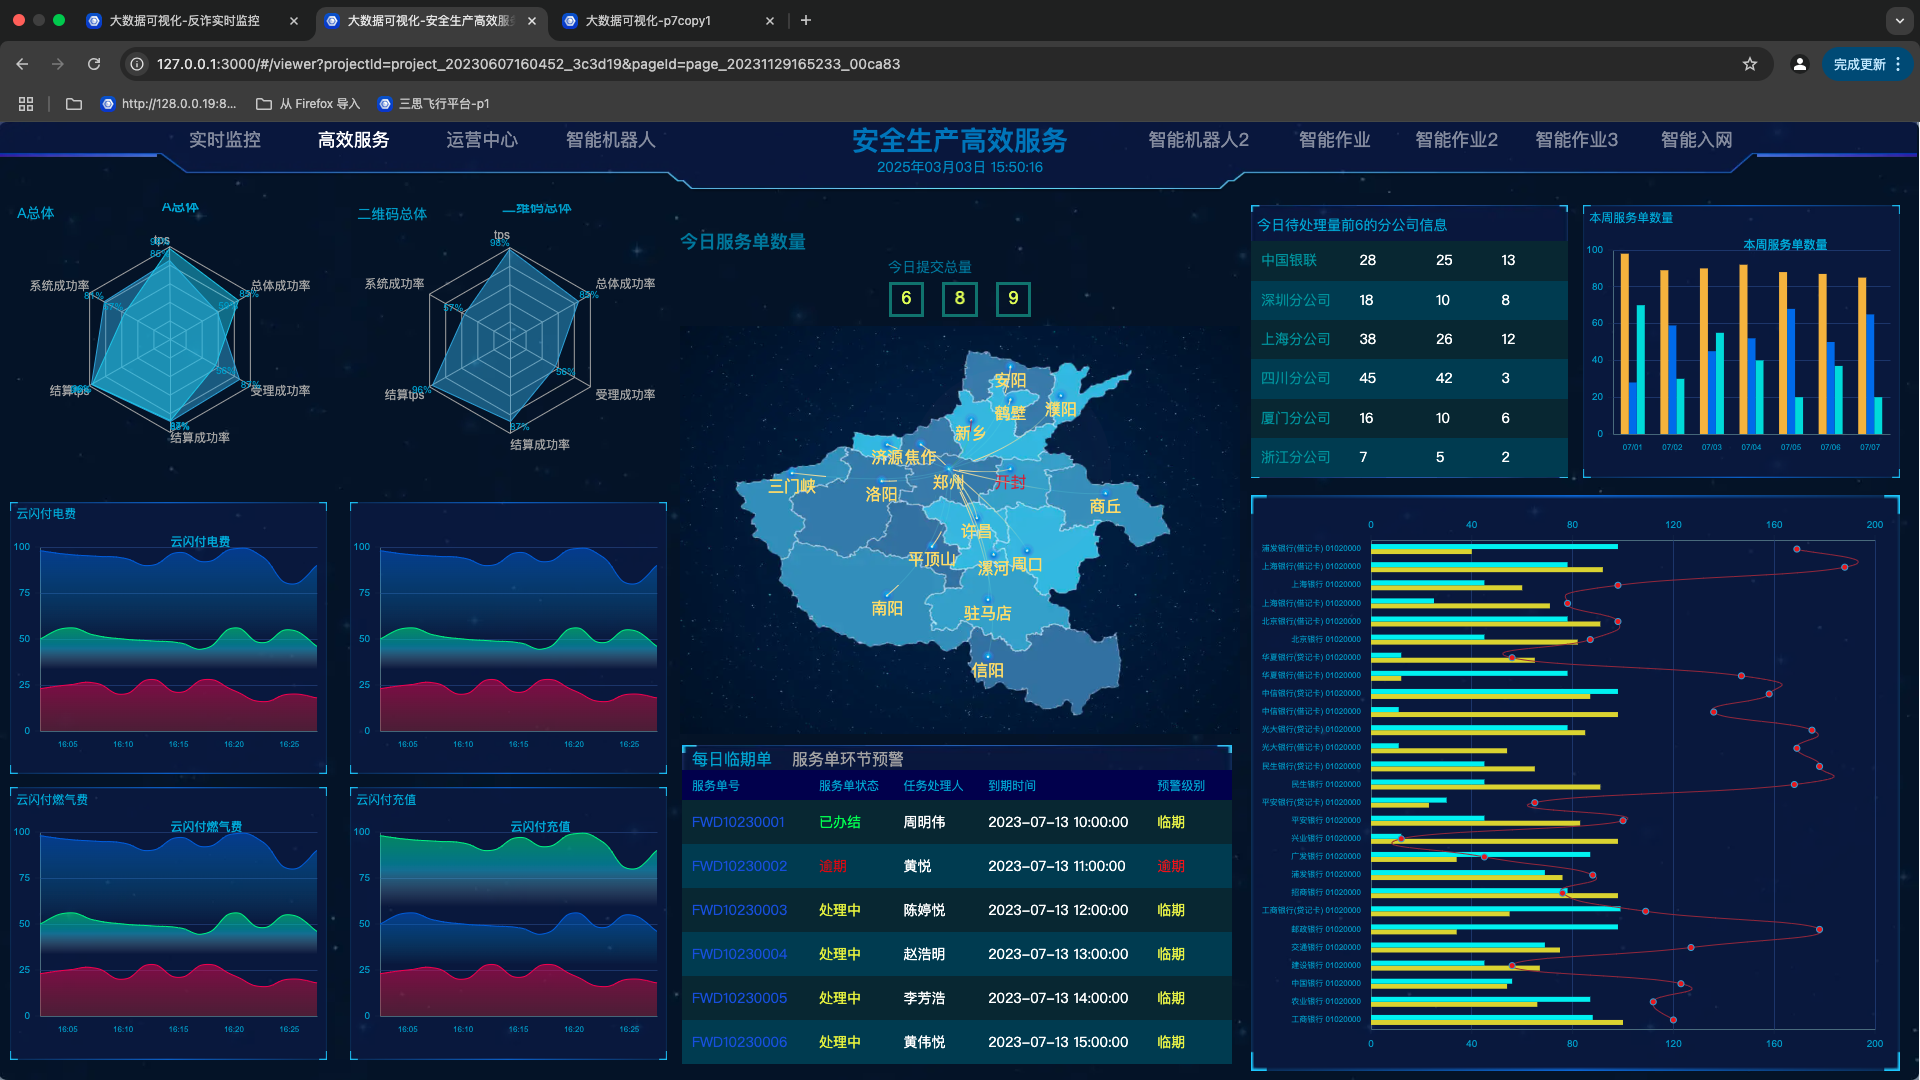
# Preview of the Page with Configured Visualization Components
# Service Data Docking
# Data Editing
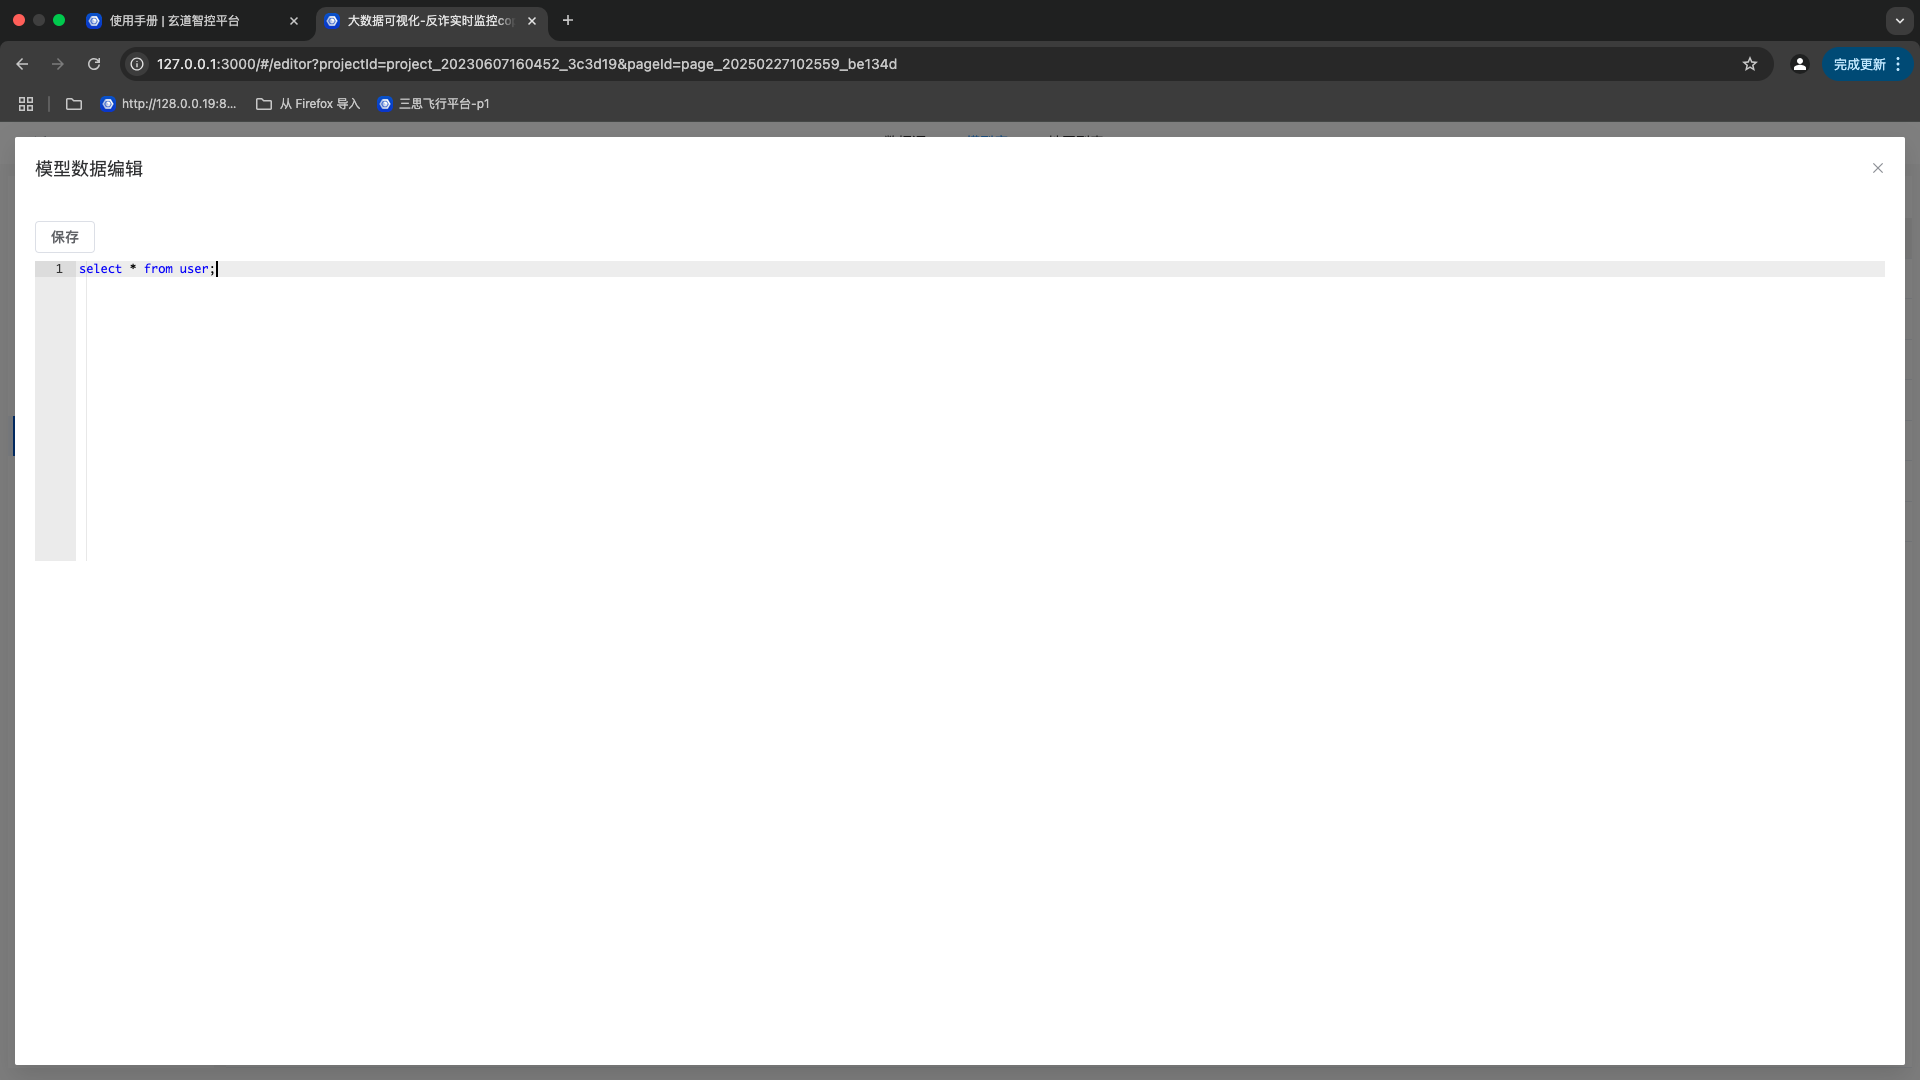
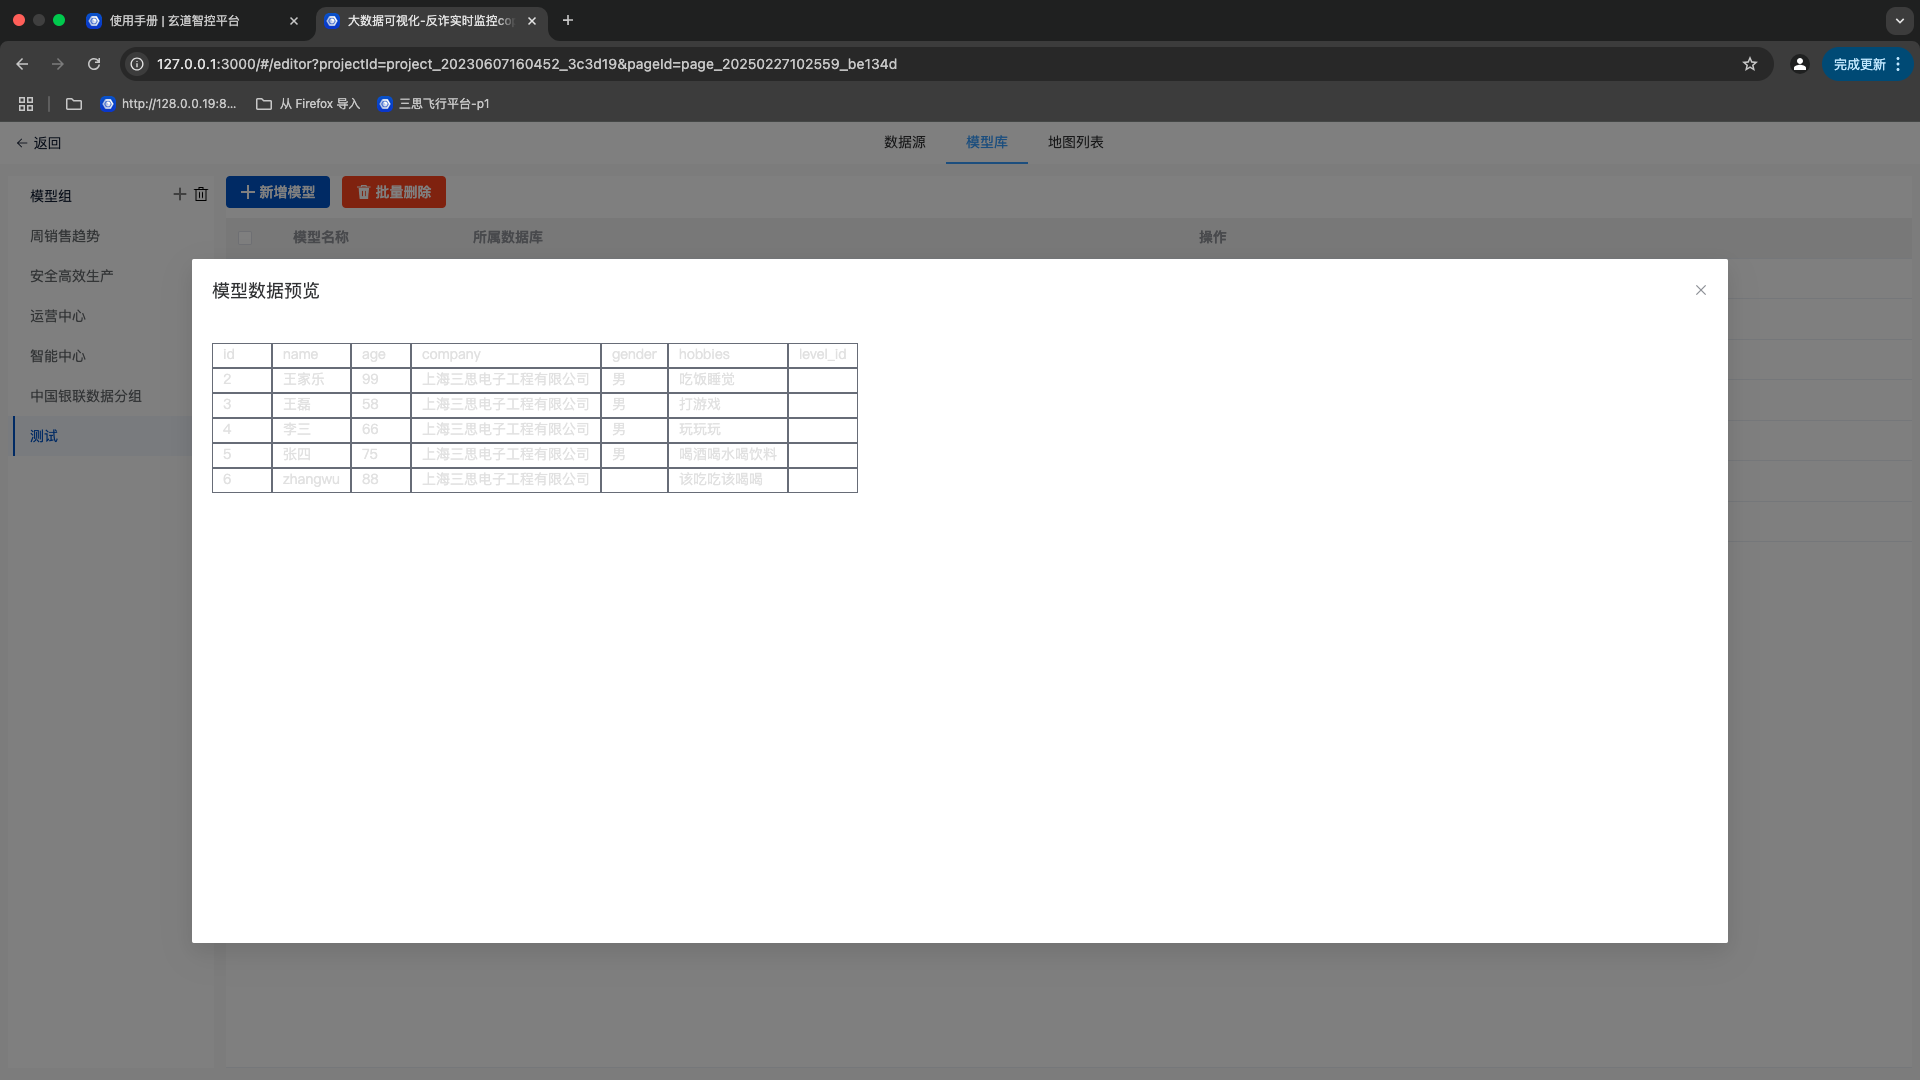
- Edit the default database data directly in the table.
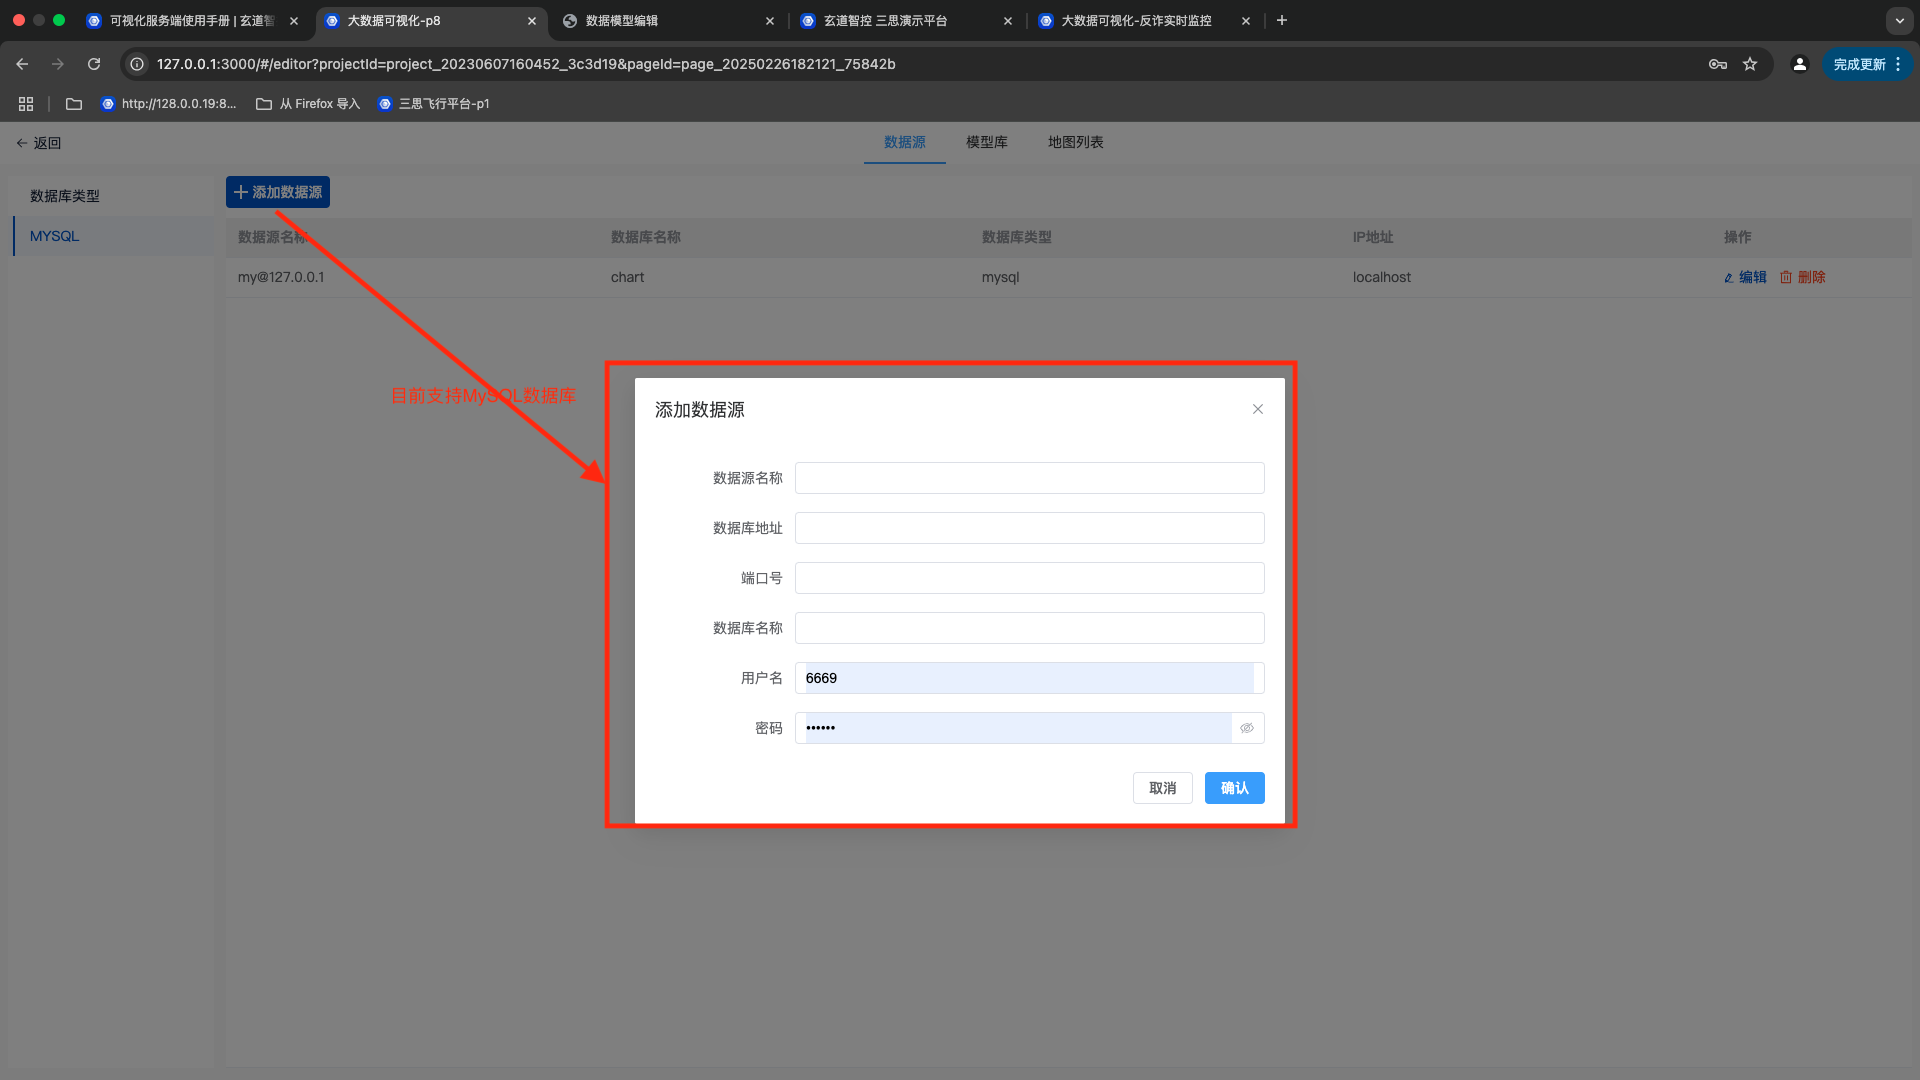
# Support for MySQL Data Types
Add MySQL data and fill in the data model name, data model group name, data model type, and data model SQL statement.
Edit the SQL statement for the MySQL data type and observe the results in the preview.
# API Interface Service Docking
Create a data model group
  Method:Post
  Request:http://127.0.0.1:10000/charts/groups/add
  Parameters:
  {
    "name": "测试1"
  }
Create a data model
  Method:Post
  Request URL:http://127.0.0.1:10000/charts/group/addModel
  Parameters:
 {
   "groupId": "7d83ace0-8006-4aa6-bde3-2169b26f0b7c",
   "title": "456789",
   "type": "default"
 }
Update the data of the data model
  Method:Post
  Request URL:http://127.0.0.1:10000/charts/group/model
  Parameters:
   {
      "groupId": "7d83ace0-8006-4aa6-bde3-2169b26f0b7c", // 分组id
      "id": "1816598a-79de-48bc-aafe-23a9663292b9",     // 数据模型id
      "title": "567888",
      "header": ["name","value"],
      "list": [["王同学","100"]]
   }
# 外部数据服务对接
The third-party service provides a data link in a format that meets the visualization requirements. To reduce the error rate during the configuration process, the request format is (GET). Here is an example of the data
{
   "message": "success",
   "code": 0,
   "data": {
     "title": "拦截笔数发卡行",
      "header": ["银行名称","数量"],
      "list": [
        ["中国银行","62"],
        ["中国建设银行","95"],
        ["中国工商银行","66"],
        ["中国人民银行","54"],
        ["中国华夏银行","98"],
        ["上海浦发银行","45"],
        ["招商银行","77"],
        ["苏州银行","88"],
        ["中国光大银行","91"],
        ["中国农业银行","65"]
      ]
   }
 }
配置组件绑定外部URL数据
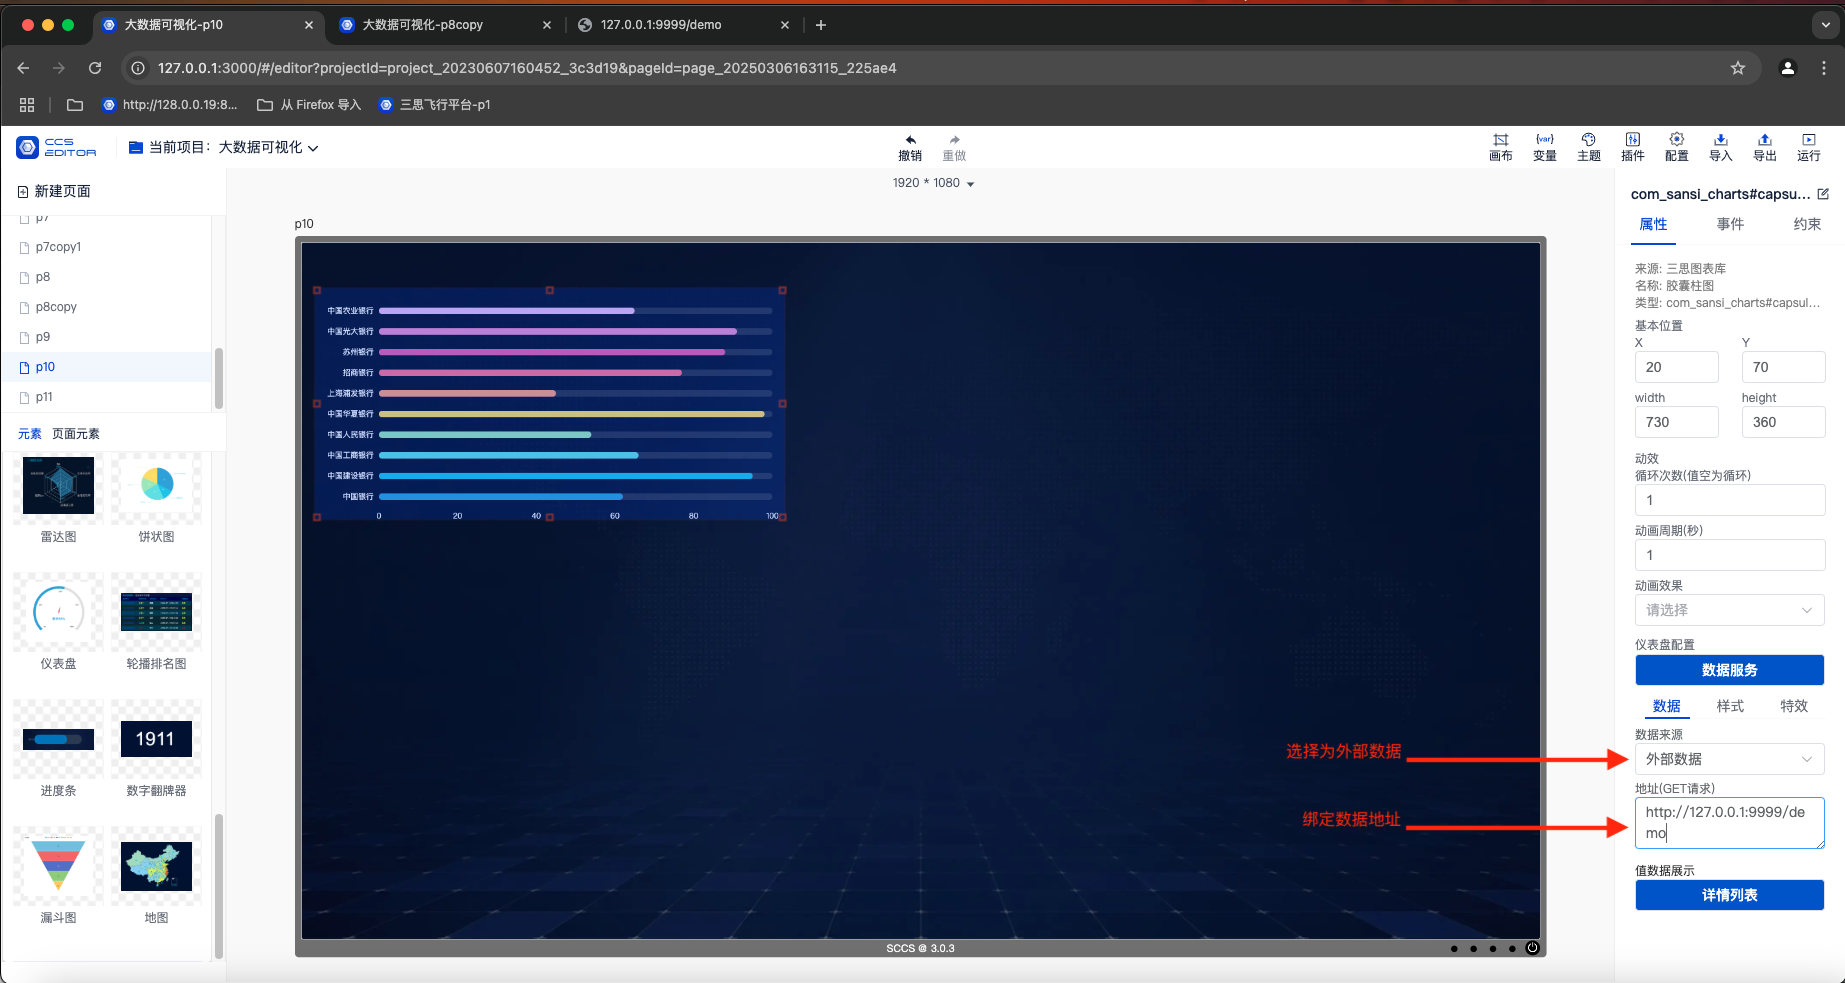
Configure the component to bind external URL data
Preview the configuration effect